East's Debt Growth Has a CNY504 Million Non-Cash Line
Following a liability increase from its non-cash recognition to subsequent cash settlement.
- Company
- East Group
- Ticker
- 300376.SZ
- Published
- September 28, 2026
- Information cutoff
- September 27, 2026
The detail
The 2025 annual report, p.180, shows CNY504.1 million of non-cash increases within a CNY568.7 million rise in long-term payables, including current portions. The 2026 interim report, p.140, then records CNY430.0 million of cash reductions and a CNY391.5 million balance decline.
Why this matters
East's 2025 financing-liability reconciliation records CNY504.1 million of non-cash additions to long-term payables. Cash-receipt, carrying-value, and contractual-payment bridges identify the missing transaction-level explanation, while substantial first-half 2026 settlement counters a simple debt-accumulation thesis.
The detail
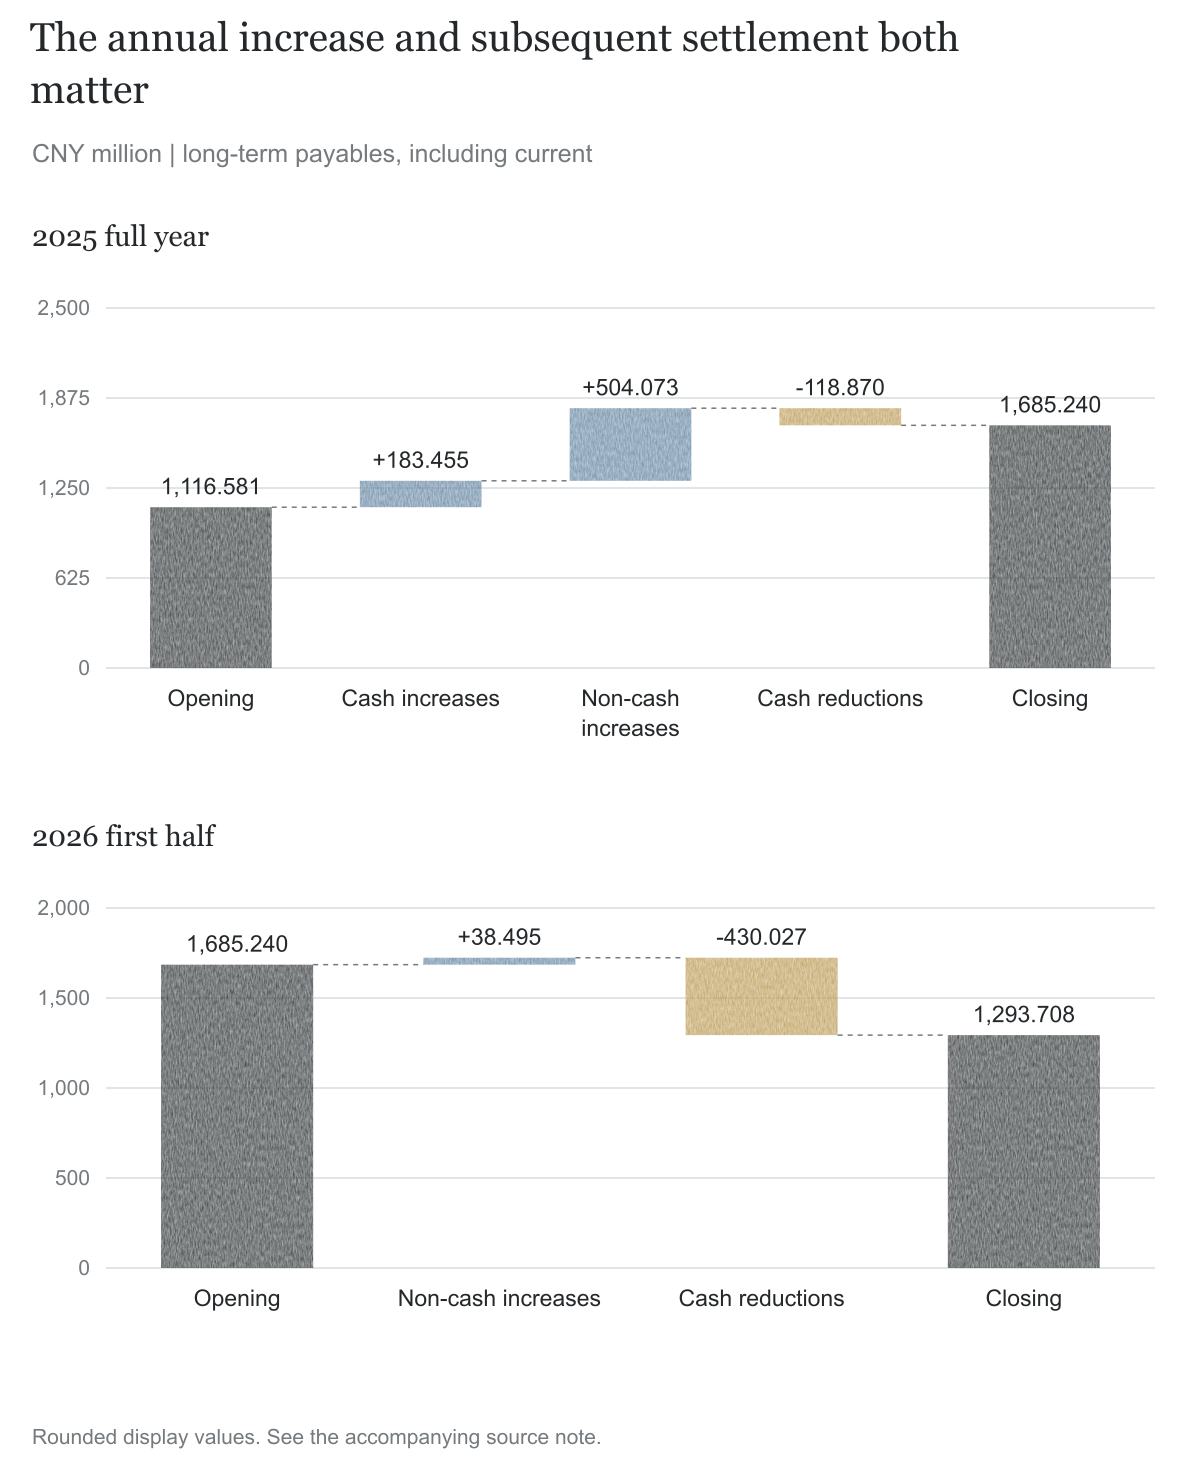
On page 180 of East Group’s 2025 annual report, a table reconciles financing liabilities from their opening balances to their closing balances. Its largest non-cash addition is not in bank borrowings. It is CNY504.073 million in long-term payables, including the portion due within one year. That row ends at CNY1.685 billion, up CNY568.658 million over the year. The non-cash addition therefore represents approximately 88.64% of the net increase in that particular balance. [S01, p.180]
An investor scanning only the borrowing lines could miss this movement. An investor reading only financing cash receipts could misunderstand it in a different way: a liability can increase without the same amount of new cash entering the group during the period. Neither mistake requires the company to have omitted the figure. The table is there. The difficulty is connecting it to the transaction, accounting measurement, and future payments behind the balance.
The annual report received a standard unqualified audit opinion. The question arises from East’s own liability reconciliation, cash-flow notes, financing descriptions, and subsequent interim accounts. They establish the size of the movement but do not explain the CNY504.073 million non-cash addition transaction by transaction. Without that explanation, investors cannot tell which obligations or measurement changes produced the increase. [S01, pp.99,170-171,180]
The subsequent figures matter just as much. In the first half of 2026, the same long-term-payables row records CNY430.027 million of cash reductions. Its balance falls to CNY1.294 billion. A concern framed as continuing unchecked growth would already be out of date. The more durable question is what created the earlier non-cash movement, how the resulting obligations are being settled, and what that settlement requires from the group’s cash and operating assets. [S02, p.140]
Executive summary
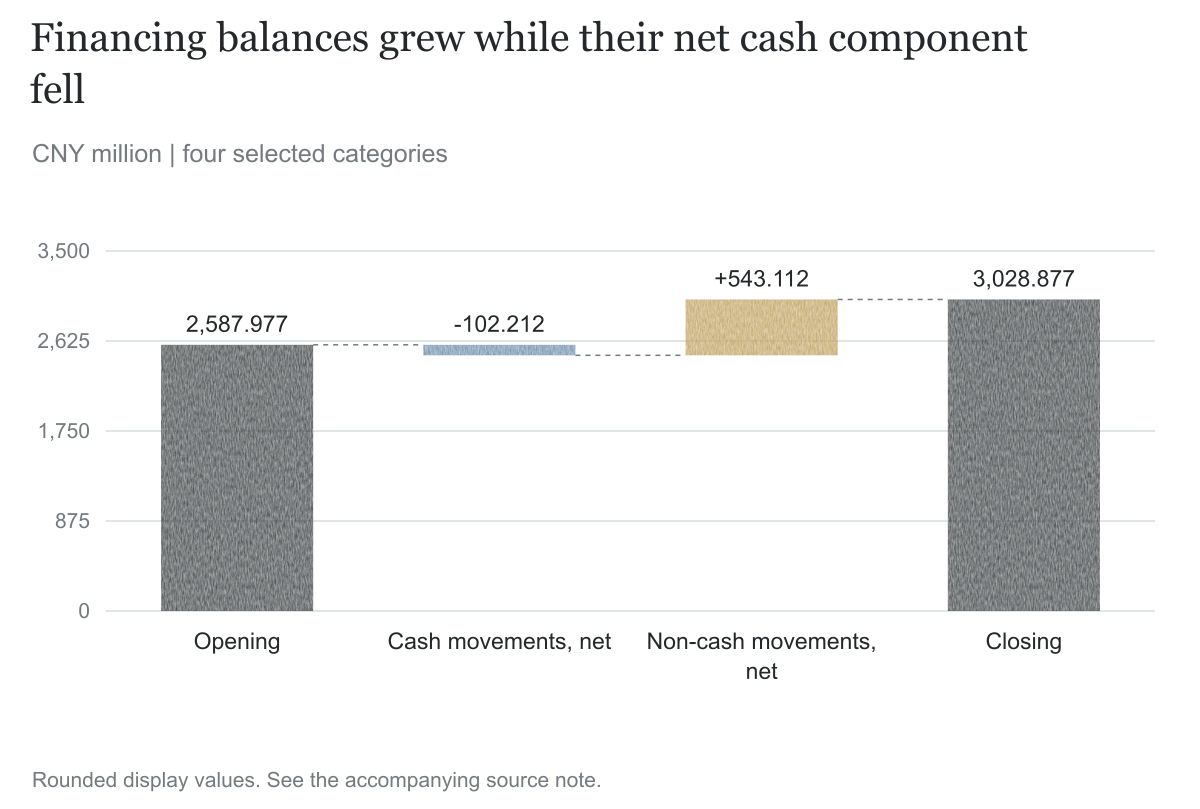
East’s 2025 reconciliation covers four financing-liability categories: short-term borrowings, long-term borrowings, long-term payables, and lease liabilities. Including their current portions, the selected balances increase by CNY440.900 million. Yet their cash additions minus cash reductions are negative CNY102.212 million. Net non-cash increases of CNY543.112 million explain the difference. The largest single addition is the CNY504.073 million in long-term payables. These four rows are not a comprehensive measure of all debt or all liabilities. [S01, p.180]
The long-term-payables note identifies financing-lease obligations and describes sale-and-leaseback arrangements supported by equipment, charging rights or related receivables, and subsidiary equity. Those descriptions explain the broad financing structure. They do not allocate the non-cash addition among new transactions, measurement effects, modifications, or other possible causes. Assigning it entirely to any one mechanism would exceed the evidence reviewed. [S01, p.171]
There is a second, smaller reconciliation question. The cash-flow note reports CNY240.955 million received from financing leases in 2025, while the long-term-payables rollforward records CNY183.455 million of cash increases. The CNY57.500 million difference needs an explanation of scope and classification. It is not, by itself, evidence that cash is missing or that either table is wrong. [S01, p.180]
By June 30, 2026, the long-term-payables balance has declined by CNY391.531 million, or approximately 23.23%. Future undiscounted payments for the category have also declined. Meanwhile, cash and cash equivalents have fallen by CNY721.187 million, with operating, investing, financing, and exchange-rate movements all contributing. The debt reduction is real counterevidence to a simple accumulation thesis; the cash decline is not wholly attributable to the lease-related payments. [S02, pp.78-79,140,151]
The financing picture requires a connection between the obligations created, cash received, assets pledged, and future payments. The periodic evidence extends through the 2026 interim report, supplemented by a June financing announcement and September investor-relations record. The transaction-level connection remains unresolved in the reviewed materials; the non-cash column alone cannot identify its cause.
Background
East describes businesses spanning power electronics, high-end power supplies, uninterruptible power systems, data-center infrastructure, and new-energy and storage-related equipment and systems. Those activities can involve both ordinary product sales and longer-lived equipment or project assets. An equipment sale, a receivable collection, a project investment, and financing secured against an operating asset create different accounting and cash-flow patterns. [S01, p.10]
For a reader starting from the income statement, revenue is the amount recognized for the period’s activities under the applicable accounting policies. Profit is what remains after recognized expenses and other gains or losses. Neither tells the reader exactly when customers pay, when equipment is purchased, or how the business obtains financing. The balance sheet records resources and obligations at a date; the cash-flow statement records specified cash movements over a period. A liability reconciliation connects those two views, but may also contain changes that did not involve cash.
Bank borrowing is the most familiar financing label. A company receives funds, owes a lender, and usually pays principal and interest over time. But the balance-sheet category named long-term borrowings is only one location where financing can appear. Lease liabilities, financing-related long-term payables, and certain other arrangements can carry their own payment obligations. Searching for the word borrowing does not necessarily produce a complete financing map.
There is also a presentation issue. A debt originally arranged for several years can have a portion payable within the next twelve months. That portion appears among current liabilities even though it remains part of the same financing arrangement. A note that explicitly includes the current portion already captures it. Adding the current balance again would count it twice. Conversely, looking only at the non-current line can omit an important part of the obligation.
East’s reconciliation helps by including the current portions in its long-term-borrowing, long-term-payables, and lease-liability rows. For the category at the center of this article, the 2025 non-current amount is CNY1,566.995 million and the current portion is CNY118.244 million. Their sum is CNY1,685.240 million, the balance in the financing-liability table. These are complementary classifications of one total, not separate debts to be added on top of that total. [S01, pp.170-171,180]
Sale-and-leaseback financing adds another layer. In an illustrative transaction, an operating company transfers an asset to a financing counterparty and continues using it under an arrangement requiring payments. The legal form, whether the transfer qualifies as a sale for accounting purposes, and the financing terms affect what stays on the balance sheet. A reader cannot infer the accounting simply from the word lease.
East’s accounting policy distinguishes transfers that qualify as sales from transfers that do not. For a transfer that does not qualify, the policy describes continuing recognition of the asset and recognition of a financial liability corresponding to the transfer proceeds. That is useful background to the financing structure. It does not prove that the CNY504.073 million non-cash addition arose from such a transfer, or explain its individual components. A general policy is not a transaction ledger. [S01, p.141]
The distinction matters for both optimistic and pessimistic readings. Keeping an operating asset on the books does not mean the financing has no economic cost. Recording a liability without a matching cash receipt in the same period does not mean the liability is fictitious. The actual question is which transaction or measurement event explains the change, and how that obligation will be met.
The documentary trail
The 2025 annual report provides a three-year operating comparison, financing-liability movements for 2025, the year-end classification of liabilities, the security description, and future contractual payment information. It also notes earlier accounting corrections and says that the 2023 comparative figures shown have been restated. The five-year operating table below combines that report with the restated 2022 comparative in the 2024 annual report and the adjusted 2021 amounts in the earlier correction announcement. It does not use the original, uncorrected figures for those years. [S01, p.8; S03, pp.10,14; S04, p.8]
The annual report’s narrative and accounting notes need to be read together. A table in the liquidity-risk section lists bank borrowing, notes payable, trade payables, other payables, lease liabilities, and long-term payables. It is broader than the four financing rows on page 180. The fact that a category is absent from the four-row reconciliation does not mean it is absent from the group’s obligations. [S01, pp.180,191]
The annual report was disclosed on April 29, 2026. Its closing balance-sheet figures refer to December 31, 2025; its cash movements cover the 2025 year. A publication date is not the date on which every reported payment happened. The CNY504.073 million addition belongs to that annual reporting period, not automatically to the day the report became public.
The 2026 interim report was disclosed on August 29, 2026. It provides a comparable financing-liability reconciliation for the first six months of 2026 and a June 30 balance sheet. Its starting figures match the annual reconciliation’s closing balances. This continuity makes it possible to follow the selected obligations into the next reporting period rather than treating the annual increase as the last available observation. The interim report states that its financial statements are unaudited. [S02, pp.70,140]
The sequence is therefore specific: obligations grew in the 2025 reconciliation, principally through non-cash movements in the selected categories; substantial cash reductions followed in the first half of 2026; and the group reported a lower closing cash balance. Those facts do not reveal every transaction that links the dates. They do establish the sequence that any explanation must accommodate.
Follow-up searches covered CNINFO announcement titles and investor-relations records dated March 1 through September 27, 2026, including the September 23 investor record. Selected documents were reviewed in full. The search did not cover every financing announcement or platform, so an answer may exist outside the materials examined.
How the mechanism works
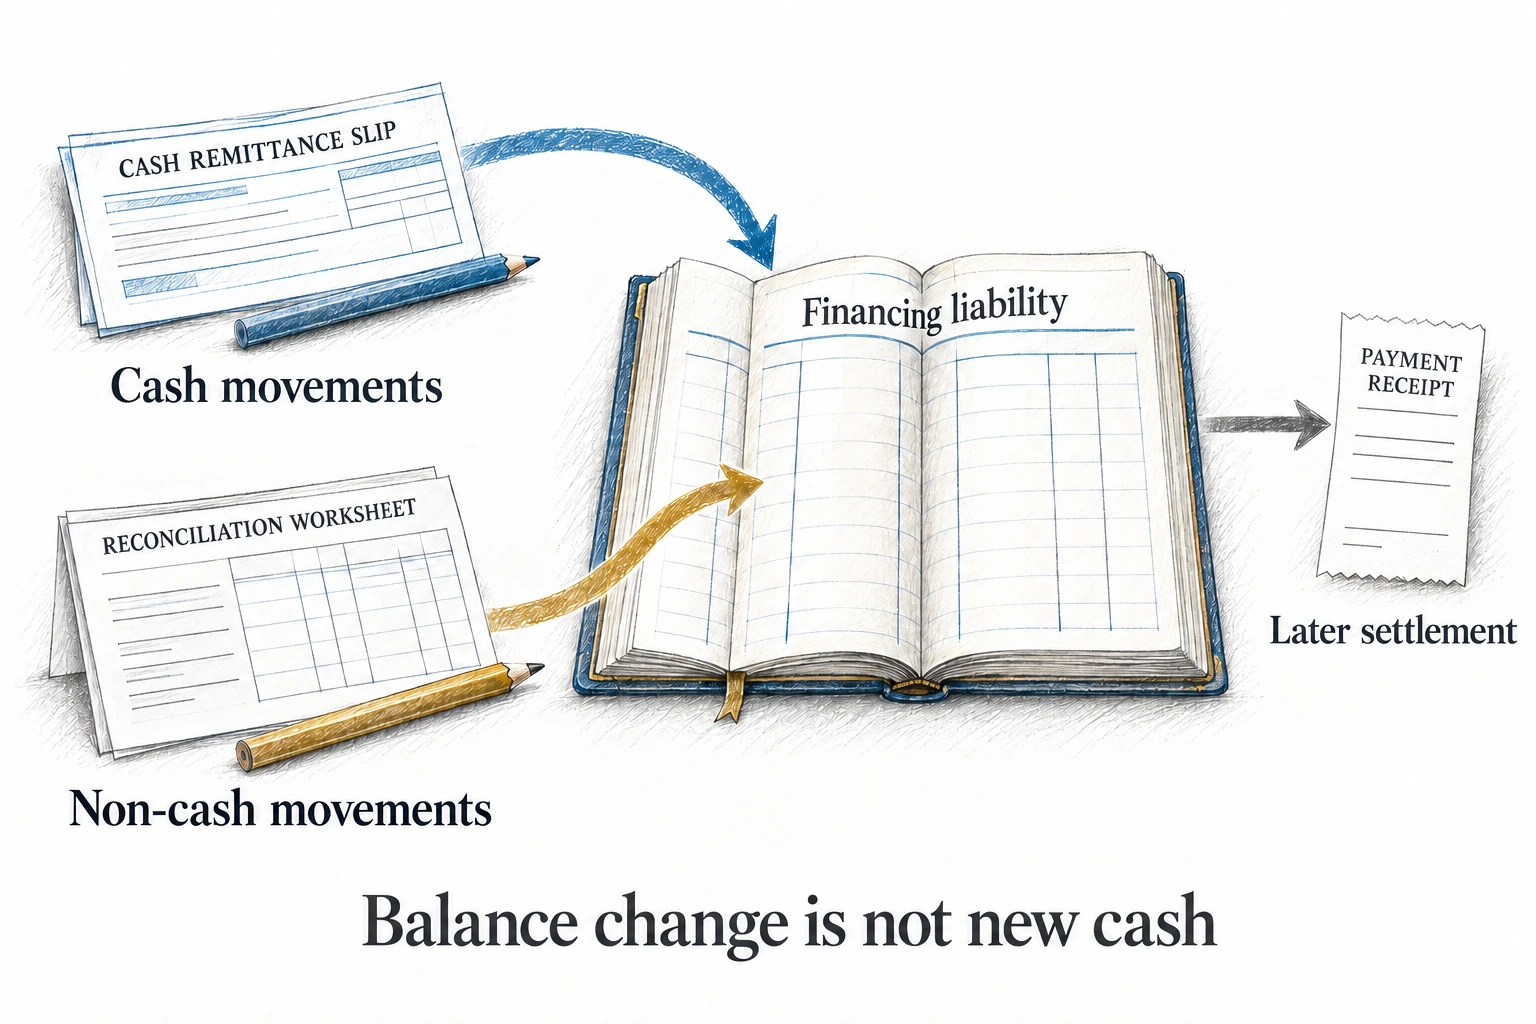
A liability can change without new cash
A financing liability is a measured obligation, not a running total of bank deposits received. Its balance can change through cash transactions and through accounting or contractual events that do not themselves produce a cash movement at that point. The financing-liability table separates those two types of change precisely because they answer different questions.
Consider a hypothetical company with an opening financing liability of CNY100 million. During the year it receives CNY20 million, makes CNY30 million of liability-reducing payments, and records CNY15 million of non-cash increases. Its closing liability is CNY105 million. Cash related to that reconciliation has declined by CNY10 million, but the liability has grown by CNY5 million. There is no arithmetic contradiction. The CNY15 million non-cash component is what reconciles the observations.
The explanation of that component remains essential. In different arrangements, non-cash movements can involve financing of assets without a contemporaneous cash receipt by the reporting entity, accrued financing costs, remeasurement, contractual changes, or changes in the reporting boundary. This list describes possible mechanisms, not a diagnosis of East’s balance. Their economic implications differ, so a large unexplained aggregate should not be assigned to the most convenient example.
If a component is accrued financing cost, the liability may be increasing because an expense or a capitalized cost is recognized before payment. If it is an asset-related financing transaction, a resource and an obligation may arise together without cash passing through the company’s account in the same way as a conventional loan. If it is a modification, the accounting movement and future payment schedule need to be assessed together. Identifying which applies requires the actual transaction terms and entries.
That is why calling every non-cash increase new borrowing can mislead. It may describe the growth of the measured obligation but imply cash support the group did not receive in that reporting period. Calling it merely accounting can be equally misleading if it causes readers to ignore future payment requirements. Non-cash at recognition does not mean non-cash forever.
Cash receipts and liability additions need a common boundary
A cash-flow note and a liability reconciliation can use different scopes. A cash receipt can contain amounts that do not create the particular liability being reconciled. A liability movement can include adjustments that are outside the cash-flow category selected by a reader. The right response to a difference is to identify the boundary of each table before making an accusation or declaring the difference irrelevant.
For East, the specific comparison is between CNY240.955 million of financing-lease cash receipts and CNY183.455 million of cash additions to long-term payables. The difference is CNY57.500 million. The reviewed material does not provide a sufficiently detailed bridge to assign that difference to taxes, deposits, fees, other liabilities, or any particular transaction. Each would be a hypothesis requiring documents, not an established explanation. [S01, p.180]
The same caution applies to payments. The annual note’s CNY118.870 million financing-lease cash payment matches the long-term-payables row’s cash reduction. That numerical match is useful. It does not establish that every unit is interest, every unit is principal, or that the payment label describes a single legal financing contract. The components of the payment require a schedule showing opening principal, financing cost, fees, cash settlement, and closing balance.
Readers should also distinguish obtaining new funds from releasing funds already held under a restriction. A released guarantee deposit can increase cash available for use without creating a new loan. A new deposit or pledge can reduce available cash without extinguishing debt. If both sit in financing-related cash-flow notes, adding every receipt together and calling the total new credit would erase that distinction.
Book value and future payments answer different questions
The balance sheet generally does not present a financing obligation as a simple sum of every future undiscounted payment. The liquidity note presents future contractual amounts on a different basis. Those amounts may include financing costs embedded in future payments and reflect timing that is not captured by the carrying amount alone. The exact composition still depends on the contracts.
As an illustration, an obligation carried at CNY100 million might require CNY115 million of payments spread over several years. The difference is not automatically an omitted current liability or an overdue penalty. Nor should a reader dismiss the CNY15 million because it is outside the present carrying amount. It represents part of the future cash burden under the assumed schedule. This illustration is not a reconstruction of East’s contracts.
The current portion introduces another distinction. A current carrying amount classifies part of the recognized liability by maturity. A next-year undiscounted payment bucket describes scheduled cash outflows on the note’s contractual basis. The two numbers can differ without either being wrong. They should be compared thoughtfully, not added together as if they were independent debts.
Security affects flexibility without eliminating productive use
East describes financing-lease security involving ownership of power-generation and storage equipment, charging rights or related receivables, and 100% subsidiary equity. Such support can help financing counterparties accept a transaction. It can also affect how freely the group can sell an asset, pledge a cash-generating right elsewhere, or reorganize ownership. [S01, p.171; S02, p.132]
An encumbered asset may nevertheless continue operating and generating revenue. A mortgage or pledge is not evidence that production has stopped or that the full carrying amount has been lost. Conversely, normal operation does not mean the asset is freely available to support another financing. The contractual map matters: which company owns the asset, which entity owes the payments, which receipts are pledged, and which conditions release the support?
That map cannot be replaced by an aggregate of restricted asset values. Some security tables refer to investments in subsidiaries, while consolidated accounts use a different presentation boundary. Gross amounts, carrying values, valuation estimates, and eventual recovery values are also different measures. A large sum of restrictions establishes that rights are constrained; it does not, on its own, quantify a loss or prove inadequate collateral.
What the numbers show
The four-row financing bridge
The table below reproduces the categories in the 2025 financing-liability reconciliation. Amounts are rounded to CNY million, and long-term categories include their current portions. Blank movements are shown as zero only for reconstructing this disclosed arithmetic; no additional transactions are inferred. [S01, p.180]
| Financing category | Opening | Cash increases | Non-cash increases | Cash reductions | Non-cash reductions | Closing |
|---|---|---|---|---|---|---|
| Short-term borrowings | 38.370 | 27.000 | 0.813 | 39.067 | 0.000 | 27.116 |
| Long-term borrowings, including current | 1,321.828 | 120.000 | 34.722 | 262.479 | 0.000 | 1,214.071 |
| Long-term payables, including current | 1,116.581 | 183.455 | 504.073 | 118.870 | 0.000 | 1,685.240 |
| Lease liabilities, including current | 111.197 | 0.000 | 7.094 | 12.252 | 3.589 | 102.450 |
| Total of these four rows | 2,587.977 | 330.455 | 546.701 | 432.667 | 3.589 | 3,028.877 |
Using the underlying unrounded figures, the cash component is CNY330,455,200 less CNY432,666,906.80, or negative CNY102,211,706.80. The non-cash component is CNY546,701,027.60 less CNY3,589,098.99, or positive CNY543,111,928.61. Together they produce CNY440,900,221.81 of growth in the selected balances.
This matters because the cash direction and liability direction are opposite. The group did not obtain CNY440.900 million of net cash from the movements captured by these four liability rows. Readers looking for that amount in financing cash generation would be looking for the wrong quantity. Readers seeing net cash reductions and inferring that every associated obligation declined would also be wrong.
The long-term-payables row is the dominant explanation of the increase. Its exact reconciliation is CNY1,116,581,416.46 plus CNY183,455,200 of cash increases, plus CNY504,072,943.12 of non-cash increases, less CNY118,870,025.40 of cash reductions. The result is CNY1,685,239,534.18. Cash movements alone increase this row by CNY64.585 million; the non-cash addition accounts for the remaining CNY504.073 million of its CNY568.658 million net increase.
The 88.64% calculation has a narrow denominator. It compares the non-cash addition with the net increase in long-term payables. It is not the proportion of all financing obtained without cash, the share of total group debt, or a measure of how much debt will require payment. A precise ratio becomes misleading if its meaning expands beyond its denominator.
The table also shows why financing-related long-term payables should not be confused with lease liabilities. East presents them separately. The long-term-payables balance grows substantially while the lease-liability balance declines slightly. Aggregating them may be useful for a broader financing view, but the categories cannot be exchanged casually when asking what caused a particular movement.
A narrower bank-debt reading would miss another change
The liquidity table gives year-end bank borrowing of CNY1,241.187 million, compared with CNY1,360.198 million a year earlier. That is a reduction of CNY119.011 million. The figure reconciles the short- and long-term borrowing totals, including current amounts. A statement that bank borrowing declined would be supported. A statement that the company’s entire financing burden declined would not follow. [S01, pp.180,191]
The same liquidity table reports notes payable increasing from CNY600.240 million to CNY1,341.083 million, an increase of CNY740.843 million. Notes payable are outside the four-row financing reconciliation reproduced above. Their presence is an important limitation on interpreting its total. This article does not simply add every payable to a single interest-bearing-debt estimate: trade obligations, bills, bank loans, and lease-related obligations have different terms and may require different supporting cash and collateral analysis. [S01, p.191]
The resulting question is broader than whether a loan line rose or fell. How did the funding mix change? Which obligations involve bank credit, which are linked to equipment or receivables, and which are settled through bills? Their amounts establish scale, but their cash and contractual characteristics determine the next analytical step.
The cash-receipt difference is identifiable, not yet explained
| 2025 disclosed item | CNY million | Interpretation |
|---|---|---|
| Cash received from financing leases | 240.955 | Receipt category in the financing cash-flow note |
| Cash increase in long-term payables | 183.455 | Cash component of the selected liability reconciliation |
| Difference between those two amounts | 57.500 | Scope or classification bridge still required |
| Cash financing-lease payment | 118.870 | Matches the row’s cash reduction; components not established |
Both cash-receipt figures and the payment appear on page 180. The fact that they can be placed next to each other makes the difference easy to identify. It does not make the reason self-evident. A useful response would reconcile transactions and specify where the difference is recognized, including any cash classified outside the particular liability. [S01, p.180]
The note also contains cash movements for bill and loan guarantee deposits, as well as deposit pledges and releases. Those items make it particularly important to avoid treating every financing-related receipt as fresh external borrowing. But their appearance nearby does not prove that any one of them explains the CNY57.500 million. Proximity within a note is not a transaction match.
Future payments are larger than the carrying amount
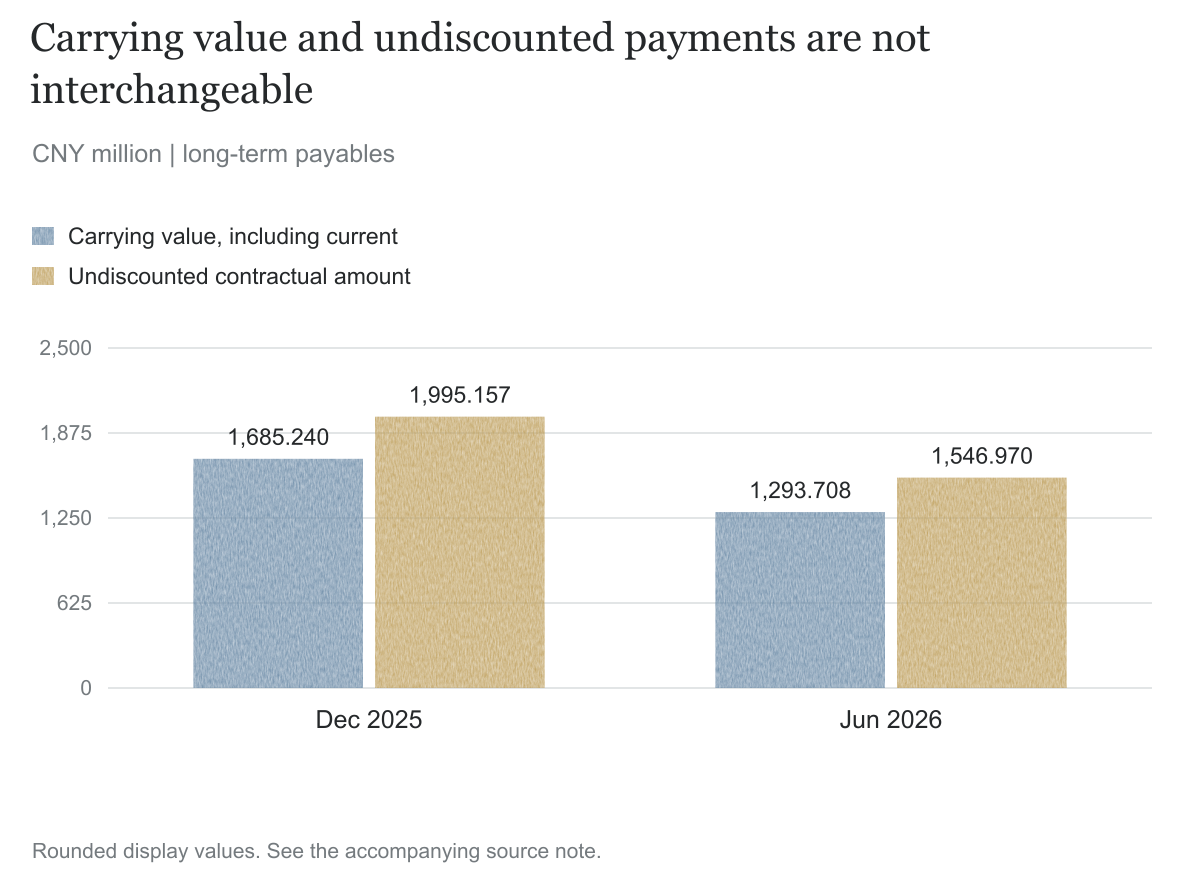
At December 31, 2025, the long-term-payables carrying amount is CNY1,685.240 million, while its undiscounted contractual amount is CNY1,995.157 million. The difference is CNY309.917 million. The contractual amount is distributed across the maturity buckets as follows. [S01, p.191]
| Long-term payables | December 31, 2025 | June 30, 2026 |
|---|---|---|
| Carrying amount, including current portion | 1,685.240 | 1,293.708 |
| Undiscounted contractual amount | 1,995.157 | 1,546.970 |
| Within one year, undiscounted | 194.743 | 162.769 |
| One to three years, undiscounted | 1,214.911 | 860.029 |
| More than three years, undiscounted | 585.503 | 524.173 |
| Current portion in the balance-sheet notes | 118.244 | 111.174 |
Amounts are CNY million. The June figures come from the interim classification and liquidity tables. The next-year bucket is not to be added to the carrying amount as a separate debt. The current portion and the next-year payment schedule are presented on different bases. [S02, pp.131-132,151]
The annual schedule concentrates much of the future contractual amount in the one-to-three-year period. That gives investors a reason to examine operating receipts, refinancing options, asset cash generation, and amortization terms over more than the next quarter. It does not establish that every scheduled payment is imminent or overdue. The dates and payment components need the underlying agreements.
The difference between book value and future contractual amounts also cannot be equated with the CNY504.073 million non-cash addition. One is a comparison of two measures at a reporting date; the other is a movement during the annual period. They may be connected by financing mechanics, but the tables do not supply a complete bridge proving how. Treating them as the same amount would obscure rather than explain the issue.
Operating improvement did not answer the financing question
| Year | Revenue | Profit attributable to listed-company shareholders | Net operating cash flow |
|---|---|---|---|
| 2021, adjusted | 3,985.748 | 510.517 | 347.895 |
| 2022, adjusted comparative | 4,741.641 | 368.354 | 424.815 |
| 2023, adjusted comparative | 4,792.587 | 562.871 | 653.097 |
| 2024 | 3,043.839 | 189.216 | 99.277 |
| 2025 | 3,670.541 | 24.012 | 920.340 |
Amounts are CNY million. Revenue recovered by 20.59% in 2025 compared with 2024 but remained below the 2023 comparative. Attributable profit declined while operating cash flow rose substantially. Operating cash was below attributable profit in 2021 and 2024, but above it in 2022, 2023, and 2025. These figures do not support a blanket claim that reported profits continually failed to convert into operating cash. They show a more varied operating picture. [S01, p.8; S03, pp.10,14; S04, p.8]
The historical corrections are material to that comparison. The correction announcement changes 2021 operating cash flow from CNY1,136.205 million to CNY347.895 million and 2022 operating cash flow from CNY926.245 million to CNY424.815 million. The corresponding investing classifications move in the opposite direction. An analysis using the old operating figures would tell a substantially different cash-conversion story without reflecting the updated record. This history explains the choice of comparative figures; it is not evidence that the 2025 non-cash financing movement has the same cause. [S03, p.14]
The operating-cash reconciliation starts with CNY22.347 million of consolidated net profit, not the CNY24.012 million attributable-profit figure in the headline table. Depreciation and other adjustments help explain why profit and operating cash differ. The distinction between consolidated and attributable results matters because the former includes results associated with non-controlling interests as well. [S01, p.181]
Three working-capital movements are particularly large: inventory contributes negative CNY1,026.199 million, operating receivables contribute positive CNY463.044 million, and operating payables contribute positive CNY995.795 million. Their combined contribution is positive CNY432.640 million. That is not the whole reconciliation, but it shows why the CNY920.340 million operating inflow should be read alongside the timing of stocks, collections, and obligations. [S01, p.181]
An increase in operating payables can support current operating cash because the group has recognized costs or obtained resources without yet paying the corresponding cash. That does not make the contribution artificial. It does mean that its persistence depends on settlement terms and future operations. Nor does the aggregate establish that all additional payables are overdue supplier accounts. The reconciliation is a timing and accounting bridge, not an enforcement finding.
The non-cash financing addition is not another operating-cash inflow to add to this table. It belongs to the financing-liability reconciliation. Adding it to operating cash generation would create a category error. The positive operating result and the increase in measured financing obligations can coexist because they track different movements.
Monetary funds were not all cash equivalents
At year-end 2025, monetary funds total CNY2,581.531 million. The cash-composition note excludes CNY1,011.808 million and reports cash and cash equivalents of CNY1,569.723 million. The exclusion includes guarantee deposits, pledged deposits, judicially frozen funds, and a small restricted account balance. Judicial freezing is only CNY18.696 million of the excluded total; the entire exclusion should not be described as frozen cash. [S01, pp.46,167,182]
One comparative-column detail is easy to misread in extracted text. The CNY200 million term deposit that could not be withdrawn at any time belongs to the prior-period column, not the 2025 closing column. Assigning it to the current period would distort the composition and could lead to deducting a restriction that is not in the current total. The original page’s column alignment resolves that ambiguity. [S01, p.182]
The broader reading discipline is straightforward: use monetary funds for the broad balance-sheet measure, and the reconciled cash-equivalent amount for that narrower measure. Once restrictions have already been excluded from cash equivalents, do not subtract them again. Neither measure, on its own, establishes the amount legally available in every subsidiary to meet every group obligation.
The first half of 2026 reverses part of the growth
The interim financing table begins where the annual table ends. Long-term payables show no cash addition in the disclosed row, CNY38.495 million of non-cash increases, and CNY430.027 million of cash reductions. The exact closing calculation is CNY1,685,239,534.18 plus CNY38,495,436.41 less CNY430,026,857.76, producing CNY1,293,708,112.83. [S02, p.140]
The decline of CNY391.531 million is substantial. The cash reduction exceeds the new non-cash addition by that amount. It would be misleading to omit this evidence and leave readers with a picture of an uninterrupted financing accumulation. It would also be premature to call every cash reduction principal repayment without the payment components. The evidence supports a reduction in the measured obligation through substantial cash settlement.
Across all four selected financing categories, the balance falls from CNY3,028.877 million to CNY2,539.372 million, a decline of CNY489.505 million. The table records CNY508 million of cash increases, CNY1,047.584 million of cash reductions, CNY60.084 million of non-cash increases, and CNY10.005 million of non-cash reductions. The short-term-borrowing row includes a CNY10 million non-cash decrease whose transaction-level cause is not established here. [S02, p.140]
The interim contractual schedule provides a second indication of improvement in the selected category: long-term-payables undiscounted amounts fall to CNY1,546.970 million from CNY1,995.157 million. The book-to-contractual difference falls to CNY253.262 million. These changes show a lower disclosed remaining amount, not just a presentation shift between current and non-current liabilities. They still do not identify every contract settled or altered. [S02, p.151]
Lower debt was accompanied by lower cash
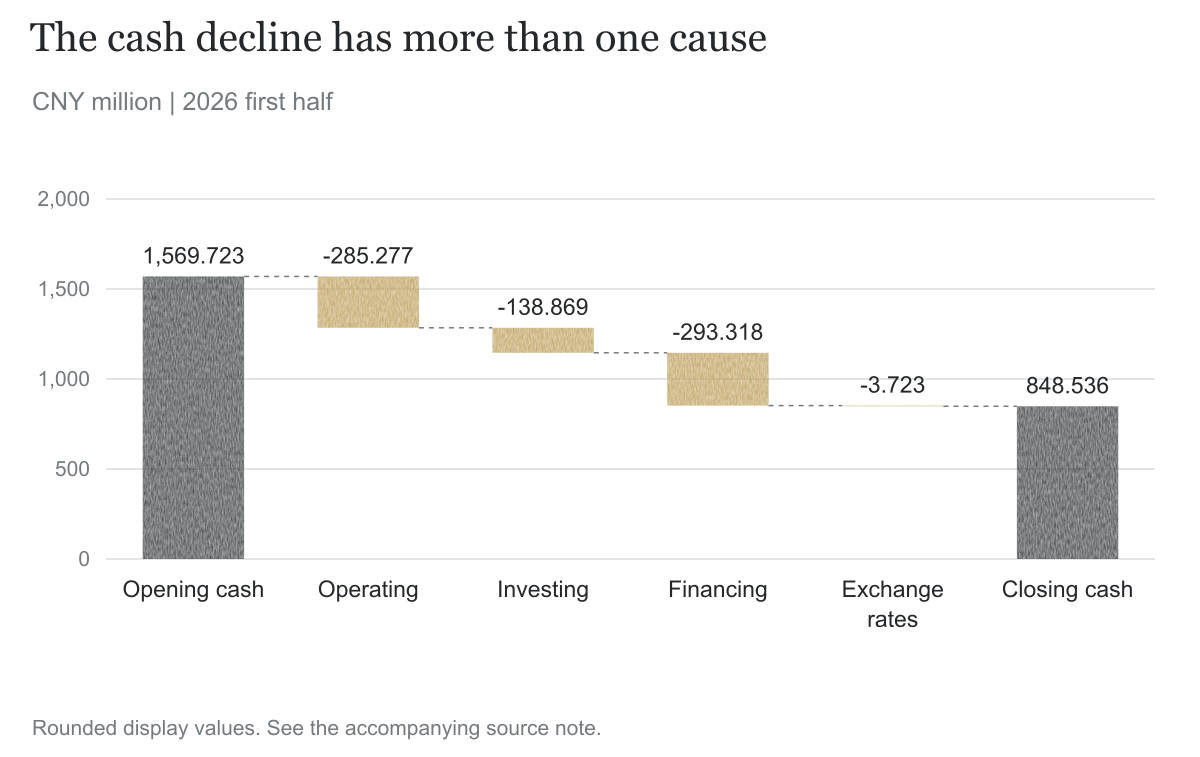
Cash and cash equivalents fall from CNY1,569.723 million to CNY848.536 million in the first half of 2026. The statement provides a full reconciliation of the CNY721.187 million decrease. [S02, pp.78-79]
| First-half 2026 cash movement | CNY million |
|---|---|
| Net operating cash flow | -285.277 |
| Net investing cash flow | -138.869 |
| Net financing cash flow | -293.318 |
| Exchange-rate effect | -3.723 |
| Total change in cash and cash equivalents | -721.187 |
The CNY430.027 million financing-lease cash reduction is important, but it does not equal the cash decline or the net financing outflow. Other receipts and payments offset or add to it. The interim financing-receipts note includes CNY499.280 million associated with guarantee deposits and released deposit pledges. Those receipts can restore cash availability without being equivalent to new loan proceeds. [S02, p.140]
Operating cash flow also changes materially, from positive CNY374.822 million in the prior-year half to negative CNY285.277 million. The operating reconciliation shows an inventory contribution of negative CNY641.283 million, partly offset by positive CNY93.989 million from operating receivables and CNY216.892 million from operating payables. The net cash pattern cannot be attributed solely to financing payments. [S02, pp.8,140-141]
The interim balance sheet reports monetary funds of CNY1,545.762 million, while CNY697.226 million is excluded from cash equivalents. Subtracting that exclusion gives the disclosed CNY848.536 million cash balance. The lower exclusion compared with year-end is relevant to availability, but the cash-equivalent balance still declines. A release of restrictions and a decline in total cash can occur during the same period. [S02, pp.70,141-142]
None of these comparisons is a default forecast. A closing cash stock, a historical cash flow, and a future payment schedule refer to different dates and depend on different conditions. A useful funding analysis would project operating receipts and payments, examine committed facilities and their conditions, and identify which assets and entities support each obligation. The reported decrease in debt and the decrease in cash are both necessary inputs.
Company explanations and competing interpretations
The company supplies several pieces of explanation that should not be ignored. It identifies the financing-lease nature of long-term payables, describes sale-and-leaseback arrangements and their security, discloses the cash and non-cash movements, and provides undiscounted payment schedules. The investor question is not based on pretending these disclosures do not exist. It is about the connection between them. [S01, pp.171,180,191; S02, pp.132,140,151]
A separate financing-and-guarantee announcement, disclosed on June 6, 2026, gives the board’s positive rationale for proposed subsidiary financing: optimizing the debt structure, improving liquidity, supporting business development, and reducing financing costs. The board says it understands the supported businesses and describes additional shareholder support or counter-guarantees as relevant protections. That is the company’s assessment, not an independently verified conclusion that each financing is risk-free. [S05, pp.1,18-19]
The same announcement makes the contractual boundary explicit: actual guarantee amounts, methods, and guarantee periods depend on the agreements signed. Proposed financing and guarantee limits should not be treated as amounts already borrowed or paid. It also states, in the document dated June 5, that the company has no overdue guarantee matters or guarantee litigation. This is useful dated counterevidence within that scope, not a statement that every borrowing is current or that all subsequent circumstances are unchanged. The announcement supports the normal-financing interpretation but does not reconcile the CNY504.073 million annual non-cash movement. [S05, pp.2,18-19]
The September investor-relations record adds a more recent positive explanation. Management says the new state-owned controller brought governance improvements and helped restore banking credit and financing channels, improving the funding and investment environment. This is the company’s assessment of financing access, not a verified statement that every proposed facility had been drawn or every financing risk had disappeared. It is relevant counterevidence to an assumption that refinancing access can only deteriorate. The cited explanation does not disaggregate the CNY504.073 million non-cash addition or the CNY57.500 million receipt difference. Those questions still require their own numerical bridges. [S06, p.2]
The strongest benign interpretation is that the CNY504.073 million consists of ordinary, properly recorded financing and measurement events whose economic details become clear at the transaction level. That is plausible as a class of explanation. It is not established merely by giving a list of possible accounting causes. The evidence required is a component breakdown that reconciles to the published amount and links each component to the relevant transaction and future cash schedule.
A second interpretation emphasizes the operating assets behind the financing. Equipment can generate receipts over time, and financing can spread its funding burden across those receipts. Security over equipment or associated rights can be part of a normal structure. To evaluate this explanation, investors would need to connect the financed assets to their operating cash generation, useful lives, contractual payment dates, and security-release conditions. An aggregate restricted-assets table cannot perform that matching by itself.
A more demanding interpretation focuses on how a large non-cash addition can postpone the point at which the cash consequences become visible. If an obligation increases without current cash support, future settlement may require operating resources or refinancing not apparent in the headline borrowing change. That is a reason to seek the bridge, not proof that the group will fail to obtain those resources. The first-half cash reductions show that substantial settlement did take place.
The subsequent payments and lower remaining contractual amount show that the liability was being reduced. They leave separate questions about the original non-cash addition, the components of the payments, and which security was released as obligations were settled.
The profit picture has its own explanation and should not be collapsed into the financing issue. The interim report records an attributable loss of CNY147.006 million but adjusted attributable profit excluding non-recurring items of CNY20.979 million. It identifies negative CNY197.798 million in other non-operating income and expenses, described principally as investor-litigation provision charges. The balance-sheet litigation provision rises from CNY122.915 million to CNY274.689 million. The provision movement and the expense amount are not identical, and neither is a record of cash already paid. [S02, pp.8,132]
Management also describes competitive pressure, product-mix and pricing adjustments, and market-development expenditure as weighing on margins and profitability. That explanation is relevant to future operating support for financing, but it does not establish that the CNY504.073 million non-cash addition caused the operating result. The financing bridge, profit bridge, and cash bridge should remain distinct until a sourced connection can be demonstrated. [S02, p.25]
The unqualified annual audit opinion provides assurance on the financial statements. The transaction-level reconciliation would serve a more specific purpose: explaining to readers how the disclosed non-cash movement arose.
What remains unresolved
The principal unresolved item is the composition of CNY504,072,943.12. A useful schedule would identify each component, the transaction date, the relevant entity and counterparty, whether an asset was recognized or retained, the accounting measurement, and the reason the movement did not appear as a cash increase in the row. It would reconcile exactly to the annual total and distinguish recurring measurement effects from transaction-specific events.
The second item is the CNY57.500 million difference between the financing-lease receipt category and the cash addition to long-term payables. Explaining that difference requires the scope of the cash-flow category and the recognition location of each transaction component. A general statement that cash flows and liabilities are different does not complete the numerical bridge, even though the difference alone is not evidence of an error.
The third item is the settlement path. Investors need to know which obligations were reduced by the CNY430.027 million first-half cash movement, how principal, financing costs and fees were treated, and which equipment, rights, or subsidiary shares were released from support. A fall in the aggregate balance shows improvement in the selected measure, but does not identify the exact source of financial flexibility restored.
The fourth item is entity-level timing. Group cash does not automatically establish that every borrower can access the same funds at every maturity date. The financing description names subsidiaries and assets, while the cash-flow statement is consolidated. A payment-and-resource map would connect those boundaries without assuming that all restrictions prevent transfers or that all consolidated cash is interchangeable.
Later disclosures could explain the non-cash movement through a transaction-level reconciliation. Further payments and collateral releases could ease the financing pressure; accelerated maturities, new pledges, or weaker cash generation could increase it. The reviewed materials do not establish those later outcomes.
Questions investors should ask
- What are the individual components of the CNY504.073 million non-cash addition to 2025 long-term payables, and which accounting or contractual events generated them?
- How do the CNY240.955 million financing-lease cash receipts reconcile with CNY183.455 million of cash additions in the liability table?
- Which parts of the annual and interim cash reductions represent principal, financing costs, fees, deposits, or other settlement components?
- Which entities and operating assets correspond to each financing arrangement, and how do their receipts align with its payment schedule?
- Which collateral or pledged rights were released following the first-half 2026 settlements, and what conditions remain?
- How should readers reconcile current carrying amounts with next-year undiscounted contractual payments without counting the same obligation twice?
- How do notes payable and other financing-related obligations change the picture beyond the four-row reconciliation?
- What subsequent filings explain the non-cash movements or update the cash, contractual maturity, and security position after June 30, 2026?
Conclusion
East’s most consequential financing movement in the selected 2025 reconciliation sits in a non-cash column. It explains how the four financing-liability balances can grow while their cash movements produce a net reduction. It also shows why a decline in bank borrowing alone is not a complete account of the group’s financing position.
The first-half 2026 report prevents that observation from becoming a one-directional story. Long-term payables fall materially following substantial cash settlement, and the remaining contractual payment amount declines. At the same time, cash falls through several categories, making it important to follow both obligations and the resources used to settle them.
The disclosure question is therefore concrete: can readers trace the CNY504.073 million from its origin, through its accounting recognition, to the assets and future payments associated with it? The reviewed tables provide the totals and meaningful subsequent evidence. They do not yet provide the full transaction bridge. That supports a request for greater explanatory detail, not a conclusion that the financing was improper or that payment failure is inevitable.
Sources
References use physical PDF pages. Tables round to CNY million; calculations use the unrounded disclosed amounts. Current portions are included where explicitly stated. The latest periodic source reviewed is the unaudited 2026 interim report, supplemented by the cited financing and investor-relations records. Transaction-level reconciling details remain unresolved.
| ID | Original title and English description | Publication date | Principal locations | Link |
|---|---|---|---|---|
| S01 | East Group Co., Ltd. 2025 Annual Report | April 29, 2026 | p.8: comparative results and restatement note; p.10: business; p.46: assets and monetary funds; p.99: audit status; p.141: sale-and-leaseback policy; p.167: restrictions; pp.170-171: current and non-current financing, security; p.180: financing cash and liability bridge; pp.181-182: operating reconciliation and cash composition; p.191: contractual maturity amounts | Issuer filing PDF |
| S02 | East Group Co., Ltd. 2026 Interim Report | August 29, 2026 | p.8: performance and non-recurring expense explanation; p.25: management explanation; p.70: audit status and balance sheet; pp.78-79: consolidated cash flows; p.128: restricted assets; pp.131-132: financing classification, security and provision; pp.140-142: financing bridge, operating reconciliation and cash composition; pp.150-151: contractual maturity amounts | Issuer filing PDF |
| S03 | Announcement on Correction of Prior-period Accounting Errors and Retrospective Adjustments | August 30, 2024 | p.1: correction scope; p.10: adjusted 2021 consolidated revenue and attributable profit; p.14: adjusted 2021-2022 consolidated operating cash flows and corresponding investing classifications | Issuer filing PDF |
| S04 | East Group Co., Ltd. 2024 Annual Report | April 29, 2025 | p.8: restated 2022-2023 comparatives and 2024 results, including the correction-basis note | Issuer filing PDF |
| S05 | Announcement on Proposed Financing by Controlled Subsidiaries and Guarantees | June 6, 2026; document dated June 5 | pp.1-2: proposal and actual-agreement boundary; pp.18-19: contractual conditions, board rationale and dated guarantee-status statement | Issuer filing PDF |
| S06 | Investor Relations Activity Record | September 23, 2026 | p.2: management’s account of governance, credit access, and funding improvements | Issuer filing PDF |
Disclaimer
This report is based on the cited public information available by the stated cutoff and is prepared for educational and investor-protection purposes. It is not investment, legal, or accounting advice, or a recommendation to buy, sell, or hold any security. Hypothetical examples do not estimate East’s actual transactions, obligations, or default probability. The transaction-level reconciliation remains unresolved in the materials reviewed. No misconduct is alleged unless a competent authority has made such a finding. Readers should conduct their own due diligence.