Moutai's Cash-Flow Surge Has a Deposit Footnote
How deposits and interbank placements change the meaning of consolidated operating cash-flow growth.
- Company
- Kweichow Moutai
- Ticker
- 600519.SH
- Published
- August 30, 2026
- Information cutoff
- August 29, 2026
The detail
The 2026 interim report, pp.97–98, identifies CNY25.426 billion of related-party deposits accepted by the finance subsidiary, not deposits made by the listed company with its parent. Changes in two rows on pp.33–34 account for CNY57.206 billion of the CNY57.572 billion operating cash-flow increase.
Why this matters
Two financial cash-flow rows reconcile approximately 99.36% of Moutai's first-half 2026 operating cash-flow increase. The deposit note, consolidation boundary, and cash composition explain why that surge is not a direct measure of liquor cash conversion or immediately distributable surplus.
The detail
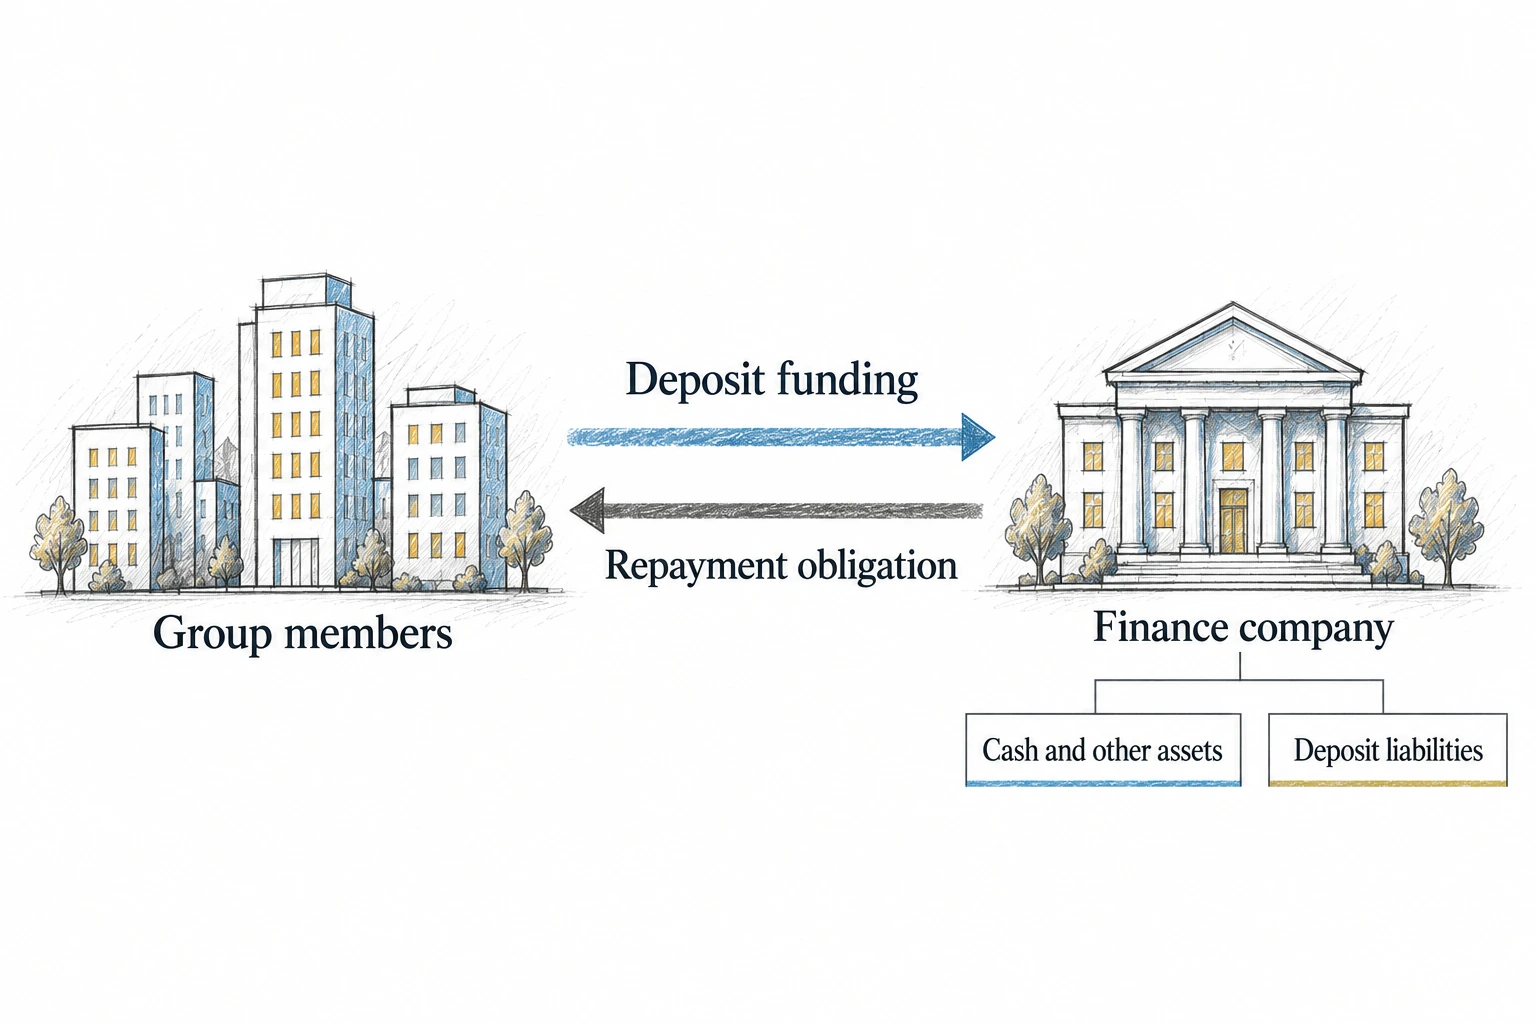
A table near the end of Kweichow Moutai’s 2026 interim report lists CNY25.426 billion of related-party deposits. The largest depositor is the controlling group, with CNY15.159 billion. These are not amounts that the listed liquor company has deposited with its parent. The accompanying explanation identifies deposits accepted by the listed company’s controlled finance subsidiary. They are liabilities of the receiving institution, including accrued interest. Reversing that direction would reverse the meaning of the table. [S03, pp.97-98]
That definition matters well beyond the related-party section. The consolidated cash-flow statement combines liquor operations with a financial business. Money arriving from member-company depositors can raise operating cash flow; moving funds into certain central-bank or interbank placements can lower it. Neither movement is a sale of liquor. Yet both help determine the operating cash-flow number that a reader might compare with liquor revenue or profit.
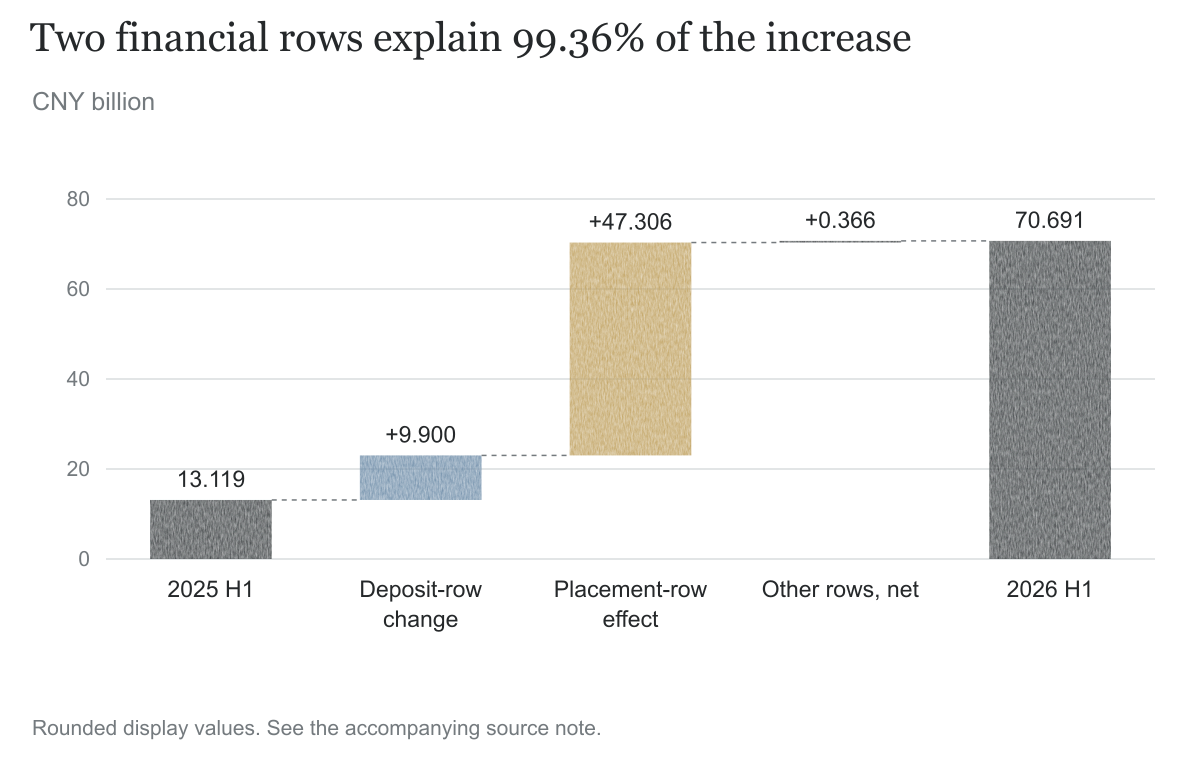
In the first half of 2026, reported operating cash flow increased by CNY57.572 billion from the corresponding half of 2025. Changes in just two financial cash-flow rows account for CNY57.206 billion of that increase, or approximately 99.36%. This is a calculation from the published statement, not a replacement accounting measure and not a claim that 99.36% of Moutai’s total operating cash flow came from those rows. [S03, pp.33-34; calculation below]
Moutai itself explains the financial-business drivers of the increase. The question is therefore not whether the company disclosed them. It did. The question is what the headline can tell an investor about cash generated by selling liquor, and what additional information is needed before a consolidated cash balance can be treated as surplus available to the listed company’s shareholders.
Review scope: Public disclosures available through August 29, 2026. The review covers the 2024 and 2025 annual reports, the 2026 interim report, and the company’s June-end finance-company risk assessment. Follow-up selection uses CNINFO announcement titles dated within this boundary; later entries are excluded. This is not a full-text review of every announcement on every platform.
Executive summary
Moutai’s cash-flow figures changed sharply in two consecutive reporting periods. Full-year operating cash flow fell from CNY92.464 billion in 2024 to CNY61.522 billion in 2025, a decline of 33.46%. In the first half of 2026 it rose to CNY70.691 billion from CNY13.119 billion a year earlier, an increase of 438.84%. Revenue and attributable profit did not move on anything like the same scale. [S02, p.6; S03, p.5]
The statements contain an important explanation. One row records the net increase in customer deposits and interbank deposits received. Another records the net increase in funds placed with the central bank and other financial institutions, on the cash-outflow side. Changes in these rows depressed the annual comparison and then boosted the half-year comparison. The direction of the placement row is especially easy to misread because a negative figure on the outflow side contributes positively to net cash flow.
For 2025 versus 2024, the two rows together contributed a negative CNY33.592 billion to the change in operating cash flow. All the remaining operating rows, taken together, contributed a positive CNY2.651 billion. For the first half of 2026 versus the first half of 2025, the same two rows contributed a positive CNY57.206 billion, while the remaining rows contributed a positive CNY365.8 million. These are bridges between reported totals. They do not isolate the entire finance business or establish that the liquor business was unchanged.
The finance subsidiary is 51% directly owned by the listed company and is consolidated. Its assets and liabilities therefore enter the group statements in full, rather than being multiplied by the listed company’s ownership percentage. At June 30, 2026, deposits from the controlling group represented approximately 59.62% of the related-party deposit total disclosed for the finance company. This is a concentration observation, not evidence of withdrawals, distress, or improper use of funds. [S02, p.120; S03, pp.86,97-98]
Cash composition supplies a second qualification. The interim report shows CNY184.811 billion of cash and cash equivalents, including CNY139.860 billion held with other financial institutions. It separately identifies CNY8.355 billion of statutory reserve deposits outside that total. The reserve must not be deducted from cash and cash equivalents a second time. Nor should every interbank balance be called restricted simply because it is held by a finance subsidiary. [S03, p.82]
The investment-relevant issue is interpretive: a consolidated operating cash-flow surge can reflect financial balance-sheet movements rather than a comparable surge in customer cash generation. An assessment of surplus cash also needs legal-entity ownership, deposit obligations, maturity information, and distribution capacity. The three reports reviewed provide a useful starting point, but they do not support a complete model of immediately distributable cash.
Why a liquor company has financial cash flows
Moutai’s name naturally directs attention toward liquor. The consolidated accounts cover a wider set of entities. The subsidiary list includes Guizhou Moutai Group Finance Co., Ltd., with a direct ownership interest of 51%. The related-party note describes that subsidiary’s deposit, lending, discounting, and factoring activities with related parties. An investor reading the liquor revenue table and then turning to consolidated operating cash flow is moving between different boundaries without necessarily noticing. [S02, pp.120,131]
The distinction begins with the word “group.” The controlling shareholder’s wider group is not identical to the perimeter of subsidiaries consolidated into the listed company. A company can be related to the listed company through common control while remaining outside its consolidated accounts. Transactions with such an entity can leave assets, liabilities, and cash flows in the listed company’s consolidated statements. Relatedness alone does not make a transaction disappear on consolidation.
By contrast, transactions between two entities within the same consolidated perimeter generally need to be eliminated when the group statements are prepared. Otherwise, moving money from one pocket of that reporting group to another would appear to create cash for the group as a whole. The important dividing line is inclusion in the consolidation perimeter, not whether both company names contain “Moutai.”
A simple hypothetical makes the distinction concrete. Suppose a finance subsidiary receives CNY100 from a member company outside the listed group’s consolidation perimeter. The finance subsidiary gains cash and owes the depositor CNY100. The listed group has a new financial asset and a new liability. It has not earned CNY100 of liquor revenue, and its net assets do not increase by CNY100 merely because the deposit arrived.
Now suppose the same CNY100 is deposited by another subsidiary inside the listed group’s consolidation perimeter. That subsidiary’s cash falls while the finance company’s cash rises. From the consolidated group’s perspective, the cash has moved internally. The reciprocal deposit asset and liability are internal balances rather than a new obligation to an outside depositor. This example illustrates the accounting boundary; it is not a description of a particular contract or movement identified in Moutai’s filings.
The 51% ownership figure introduces a separate issue. Consolidation is not a proportionate cash count. The group statement does not include only 51% of each bank account, 51% of each loan, and 51% of each deposit liability. The controlled finance subsidiary’s assets and liabilities are included in full, with the interests of other shareholders accounted for separately. Multiplying the group’s cash balance by 51% would not identify cash belonging to the listed company, just as multiplying the deposit liability by 51% would not describe what the finance company owes its depositors.
This leaves three questions that must be kept apart. What appears in the consolidated accounts? Which legal entity holds the money? What amount could ultimately be distributed to the listed company and then to its shareholders? A consolidated statement answers the first question far more directly than the other two. None of this makes the consolidated statement defective. It makes its boundary important.
The documentary trail
The 2024 annual report supplies the 2023 and 2024 cash-flow comparison. The two financial rows were already present. Operating cash flow in 2023 was CNY66.593 billion. In 2024 it increased to CNY92.464 billion, while the net customer-deposit row changed from a negative CNY810.2 million to a positive CNY11.060 billion. The placement row on the outflow side changed from a positive CNY1.570 billion to a negative CNY4.585 billion. Both row changes increased the reported operating cash-flow comparison. [S01, pp.66-67]
The 2025 annual report, published in April 2026, shows the opposite direction. Operating cash flow fell to CNY61.522 billion. The deposit row became negative CNY5.099 billion, and the placement row became positive CNY12.847 billion. Moutai explained that the decline principally reflected lower net member-company deposits at the finance subsidiary and an increase in non-demand interbank placements. The annual report thus gives both the numbers and management’s explanation. [S02, pp.6,13,64-65]
The 2026 interim report, published in August 2026, then shows another reversal. Net deposit inflow was positive CNY7.383 billion, compared with negative CNY2.517 billion in the corresponding prior half. The placement row was negative CNY21.895 billion, compared with positive CNY25.411 billion. The report attributes the operating cash-flow increase principally to increased net member deposits and reduced non-demand interbank placements. [S03, pp.5,33-34]
The same interim report contains the June-end related-party deposit list and the cash-composition note. These are different views of the financial business: one describes a liability to depositors, another describes the assets included in cash and cash equivalents, and the cash-flow statement describes movements over six months. Their relationship is economically meaningful, but they are not interchangeable measures.
The periods also differ. A December balance is a point-in-time observation. A June balance is another point-in-time observation. A six-month cash-flow figure measures activity during the intervening period. A half-year comparison should use the corresponding prior half, not the prior full year. Using CNY70.691 billion of first-half cash flow to imply an annual growth rate would introduce seasonality and timing assumptions not established by these documents.
This article uses three years of annual cash-flow data and two comparable half-year periods. It does not describe a five-year trend. Earlier history and subsequent announcements would help test persistence, but the available comparison is already sufficient to show why the headline percentage needs a financial-business explanation.
Two rows, two directions
Call the customer-deposit and interbank-deposit net increase D. It sits on the inflow side of the operating cash-flow statement. A positive D adds to operating cash flow; a negative D reduces it. Call the central-bank and interbank-placement net increase P. It sits on the outflow side. A positive P reduces operating cash flow; a negative P increases it. Their combined contribution to the operating total is therefore D minus P.
The placement sign deserves attention. If an outflow row changes from positive CNY25 billion to negative CNY22 billion, its contribution to net cash flow improves by approximately CNY47 billion. The improvement is not merely CNY3 billion, and it is not a CNY47 billion deterioration. The row’s location in the statement determines how the sign enters the calculation.
Consider another hypothetical. A finance company receives CNY10 in new external deposits and places CNY8 into funds classified outside cash and cash equivalents. If the two movements enter the selected operating rows, their net contribution is CNY2. The institution has both additional resources and additional obligations. It has not generated CNY2 by selling the industrial product of its parent company.
In the next period, suppose depositors withdraw CNY4 and CNY7 of placements return to cash. D is negative CNY4; P is negative CNY7. D minus P is positive CNY3. The selected rows increase operating cash flow despite a net withdrawal of deposits. This is why identifying only the direction of the deposit balance is not enough. Asset deployment can outweigh the funding movement.
These examples do not establish the terms, exact settlement dates, or identity of the actual transactions behind Moutai’s rows. They show the mechanics needed to read the disclosed numbers. The actual evidence is the cash-flow statement and the company’s explanation of member deposits and non-demand placements.
For a financial institution, deposit funding and financial-asset deployment are part of operations in a way that differs from an industrial company’s customer receipts. An analyst may still need a separate view of the liquor business, but that analytical need is not evidence that the published classification is improper. This review does not propose a reclassification or allege an accounting error.
It also does not remove the whole finance subsidiary by removing two rows. Lending cash flows, interest, taxes, and other financial-business items can remain in the rest of the operating statement. Calling the resulting subtotal “liquor cash flow” would replace one boundary mistake with another.
What the annual numbers show
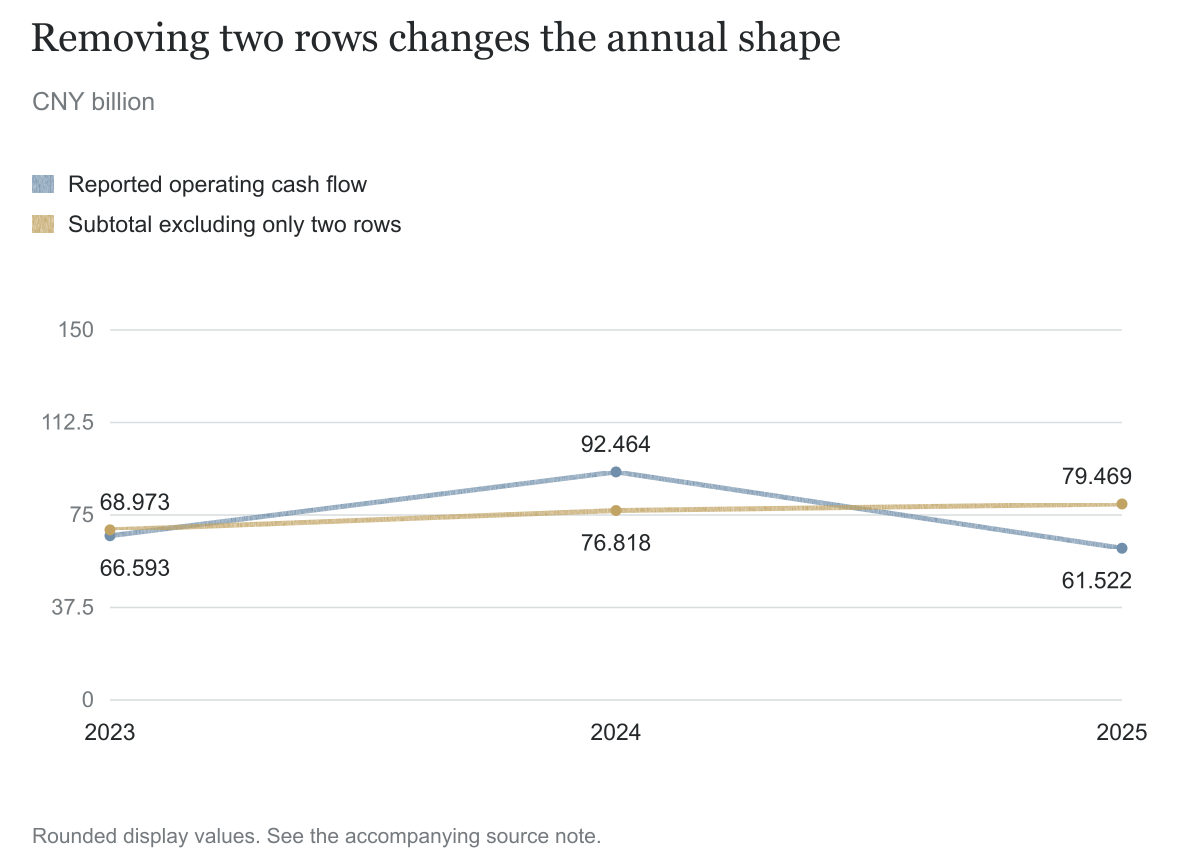
The following table uses CNY billion, rounded to three decimals. Calculations use the unrounded amounts in the source statements. The final column is a teaching subtotal that removes only D and P from the reported total: reported operating cash flow minus D plus P. It is not an officially reported segment measure.
| Year | Reported operating cash flow | D: deposits received, net | P: placements, outflow-side net | Subtotal excluding only D and P |
|---|---|---|---|---|
| 2023 | 66.593 | -0.810 | 1.570 | 68.973 |
| 2024 | 92.464 | 11.060 | -4.585 | 76.818 |
| 2025 | 61.522 | -5.099 | 12.847 | 79.469 |
Sources: S01, pp.66-67; S02, pp.64-65. The subtotal is the author’s arithmetic, not a restatement of the company’s accounts.
Reported operating cash flow peaks in 2024 and falls sharply in 2025. After excluding the two specified financial rows, the subtotal rises across the three years shown. The rows therefore materially affect the reported trend. This adjustment does not isolate liquor operations, so it cannot establish that business’s cash-flow growth rate or sustainability.
The 2025 decline can be reconstructed directly. Reported operating cash flow changed by negative CNY30.941 billion. The deposit row changed by negative CNY16.159 billion. The placement row’s contribution changed by negative CNY17.433 billion, because the outflow-side number moved from negative to positive. Together, those two changes were negative CNY33.592 billion. The remaining operating rows offset CNY2.651 billion of that decline.
| Bridge from 2024 to 2025 | Effect on operating cash-flow change, CNY billion |
|---|---|
| Change in D | -16.159 |
| Negative of change in P | -17.433 |
| Combined effect of the two selected rows | -33.592 |
| Net effect of all remaining operating rows | 2.651 |
| Reported operating cash-flow change | -30.941 |
This is an additive reconciliation. It does not assign motives or estimate what management would have done under a different funding arrangement. It simply explains how the reported annual difference is assembled.
Revenue provides context for why this reconciliation matters. Annual revenue was CNY147.694 billion in 2023, CNY170.899 billion in 2024, and CNY168.838 billion in 2025. Profit attributable to shareholders was CNY74.734 billion, CNY86.228 billion, and CNY82.320 billion respectively. The 2025 revenue decline was 1.21% and the attributable-profit decline was 4.53%, compared with the 33.46% decline in consolidated operating cash flow. [S02, p.6]
One could divide operating cash flow by attributable profit and describe the result as cash conversion. That ratio would mix financial funding movements with a profit figure after attribution to shareholders. Without explaining the finance subsidiary, the ratio could imply a deterioration in liquor collection that the ratio itself does not establish. The bridge is more informative because it identifies what changed, rather than attaching a broad interpretation to a quotient.
The remaining operating subtotal increased in 2025, but even that observation is limited. Receipts and payments can offset each other. A rise in one type of customer receipt can coexist with a fall in prepayments or a change in taxes. A small net movement does not imply small gross movements. The subtotal should be used to narrow the question, not to close the analysis.
The first-half surge, reconciled
The corresponding half-year table shows an even larger contrast. Again, the last column excludes only the two selected rows and should not be read as the whole nonfinancial business.
| Period | Reported operating cash flow | D: deposits received, net | P: placements, outflow-side net | Subtotal excluding only D and P |
|---|---|---|---|---|
| First half of 2025 | 13.119 | -2.517 | 25.411 | 41.047 |
| First half of 2026 | 70.691 | 7.383 | -21.895 | 41.412 |
Source: S03, pp.33-34; CNY billion. Author’s calculation in the final column.
The exact reported increase is CNY57,571,689,087.73. The change in D contributes CNY9,899,658,148.28. The negative of the change in P contributes CNY47,306,240,453.43. Together they contribute CNY57,205,898,601.71. The balance, CNY365,790,486.02, is the net change in all remaining operating rows.
Dividing the selected two-row contribution by the reported increase gives approximately 99.36%. The denominator is the increase, not the current-period operating total, not cash at the balance-sheet date, and not revenue. The figure does not mean that almost all Moutai cash belongs to depositors. It means that almost all the change in this particular half-year operating total can be reconciled to changes in two specified rows.
This qualification is essential because a dramatic percentage travels more easily than its denominator. The 438.84% reported growth rate starts from CNY13.119 billion in the prior half, a period in which the placement row exerted a substantial negative effect. The new period contains the opposite placement effect. Part of what appears as a surge is the comparison between those different financial deployment patterns.
Moutai’s first-half revenue increased by 1.47% to CNY90.703 billion, while attributable profit fell by 1.95% to CNY44.517 billion. Neither figure needs to track cash flow exactly, but the contrast makes it especially important to explain why operating cash flow grew by more than four times its prior-period level. The explanation is available in the same report. [S03, p.5]
There is no need to dismiss the increase as unreal. The statement reports actual cash-flow classifications, and the reconciliation preserves the reported total. The better question is whether the increase represents a recurring improvement in cash generated from the product business. The two-row bridge does not establish that. A comparison of deposit funding and placements does not become a forecast merely because the arithmetic is precise.
The deposit table is a liability table
The 2025 annual report states that the deposit figures in the related-party section represent amounts deposited by related parties with the finance subsidiary, including accrued interest. The table totals CNY18.038 billion at December 31, 2025. The balance-sheet note for deposits accepted reports the same total. The previous year-end deposit liability was CNY23.103 billion. [S02, pp.103,131-132]
At June 30, 2026, the related-party deposit table totals CNY25.426 billion. The controlling group has CNY15.159 billion on deposit, compared with CNY8.331 billion at the preceding year-end. The controlling group’s June balance is approximately 59.62% of the disclosed related-party deposit total. These amounts indicate a substantial funding relationship with the wider group. They do not show that the listed company transferred those amounts to the controller. [S02, p.131; S03, pp.97-98]
The direction changes the question an investor should ask. For cash deposited by a listed company with another entity, the questions concern asset recoverability, access, and counterparty exposure. For deposits accepted by a controlled finance institution, the questions concern funding obligations, maturity matching, liquidity, and depositor concentration. Both relationships may deserve analysis, but they are not the same transaction.
A deposit can increase available resources while creating an obligation of equal importance. Suppose an institution receives CNY100 and retains all of it as cash. Its cash buffer increases by CNY100, but its depositor liability also increases by CNY100. Calling the entire receipt new shareholder surplus would overlook the liability. Conversely, calling the receipt evidence that cash is fictitious would overlook the real asset. The balance sheet records both sides.
The stock-flow distinction prevents another mistake. The change from CNY18.038 billion to CNY25.426 billion in the related-party deposit balance is not exactly the CNY7.383 billion deposit cash-flow row. The note says balances include accrued interest; the cash-flow row is a period movement with its own definition. An exact reconciliation would need the relevant interest and other movement details. The difference should not be filled with an invented explanation.
Concentration also needs a time dimension. A June-end share of 59.62% does not reveal average balances, peak balances, withdrawal behavior, or maturity distribution. It does not prove that the controller needs the money immediately. It identifies where a meaningful portion of reported deposit funding sits and therefore where maturity and liquidity questions would be useful.
The reports reviewed do not establish a withdrawal shock or deposit default. This article does not assert one. A deposit-funding concentration can be worth understanding before any stress occurs, precisely because the consequences depend on asset maturities and the ability to meet withdrawals. That is a conditional mechanism, not a prediction.
What is inside the cash total?
At the end of 2025, Moutai reported CNY126.426 billion of cash and cash equivalents, down from CNY169.970 billion a year earlier. The composition note includes CNY74.097 billion of interbank balances and CNY8.473 billion of reverse-repurchase assets classified as cash equivalents. The interbank component represented approximately 58.61% of the total. [S02, p.116]
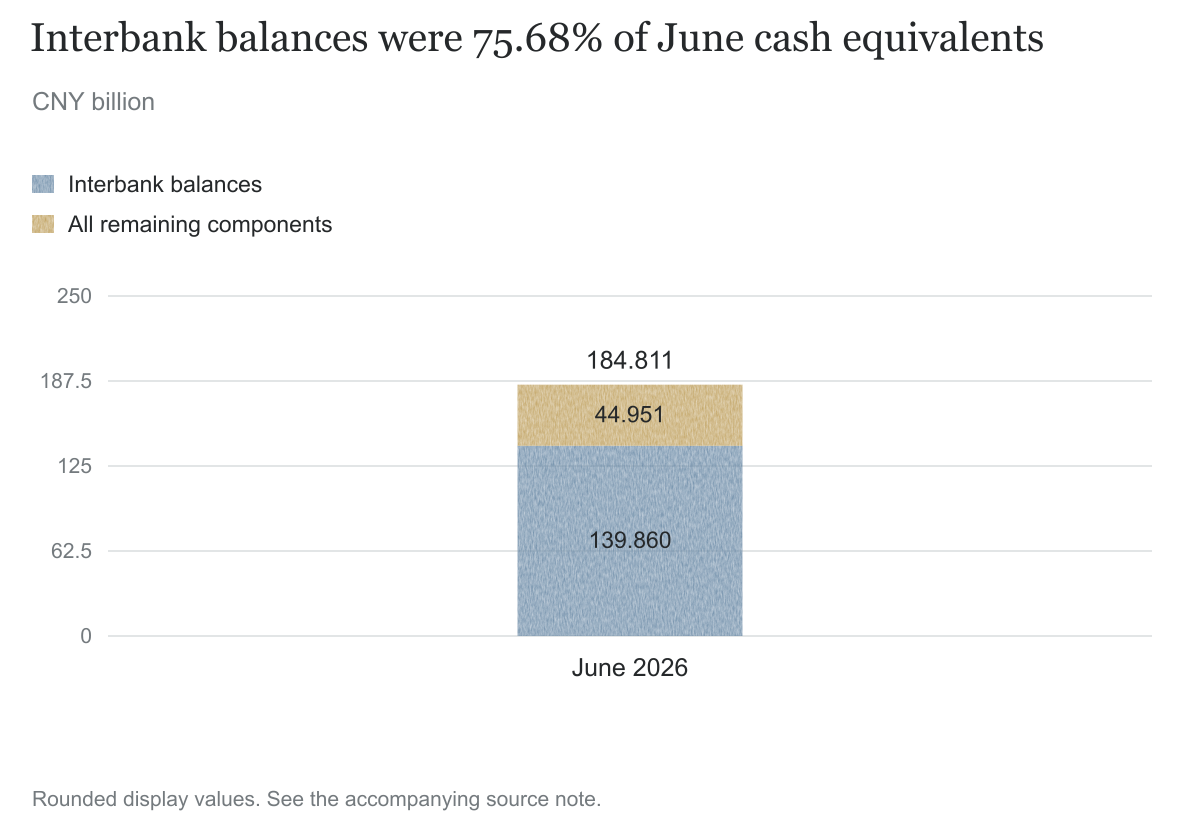
At June 30, 2026, cash and cash equivalents were CNY184.811 billion. The note lists CNY139.860 billion of interbank balances, CNY44.118 billion of bank deposits, CNY832.6 million of available central-bank balances, and a small other-cash balance. Interbank balances represented approximately 75.68% of the total. No current-period cash-equivalent amount corresponding to the preceding year-end reverse-repurchase figure is shown in that table. [S03, p.82]
These are composition changes, not merely an increase in the size of a single bank account. A reader interested in liquidity needs to understand the assets behind the total, their entity-level location, and obligations associated with the financial business. The consolidated number alone does not supply all of those details.
The reserve treatment is explicit. The annual report identifies CNY7.251 billion of statutory reserve deposits as excluded from cash and cash equivalents. The interim report identifies CNY8.355 billion on the same basis. Those amounts are already outside the reported cash-and-cash-equivalent total. Deducting them again would understate that total. [S02, p.116; S03, p.82]
The reverse error is to describe all interbank assets as unavailable. The cash-composition note includes particular balances in cash and cash equivalents; other placements can fall outside that category. A placement’s classification and access conditions need to be established from the relevant disclosure. Its name alone is insufficient to label it frozen, pledged, or otherwise restricted.
It is also unsafe to add every similar-looking financial asset line to cash. A balance-sheet category can overlap economically with a cash-composition category while including additional instruments or accrued amounts. An investor building a cash total should start from a defined measure and reconcile differences, rather than adding “bank,” “interbank,” and “placement” figures from separate tables without checking their scope.
The practical concern is thus not that Moutai has too little reported cash, or that the total should be discarded. It is that the apparent liquidity of the consolidated group is not identical to an amount freely distributable by the listed parent. Cash assets, deposit liabilities, reserve exclusions, minority interests, and legal-entity distribution paths answer different questions. A complete surplus-cash analysis would need to connect them.
Operating cash flow is not the change in cash
The year-end cash decline gives another example of how a headline can be misread. Moutai generated positive CNY61.522 billion of operating cash flow in 2025, but cash and cash equivalents fell by CNY43.544 billion. These statements are consistent. Investing and financing activities also use or release cash. [S02, pp.65-66]
In 2025, net investing cash flow was negative CNY31.642 billion and net financing cash flow was negative CNY73.427 billion. The cash statement also records a small exchange-rate effect. Adding those amounts to operating cash flow reconciles the movement in cash and cash equivalents. A decrease in cash therefore cannot be attributed entirely to the decline in operating cash flow.
Nor is all investing cash outflow spending on liquor production capacity. The annual statement shows investment payments of CNY62.097 billion and investment-recovery receipts of CNY33.455 billion. The company’s explanation refers to financial investments and interbank certificates of deposit. Treating the full investing outflow as factory capital expenditure would misdescribe the reported activity. [S02, pp.13,65]
The financing statement records CNY67.242 billion in the combined row for dividends, profit distributions, or interest payments. That combined label should not be shortened to dividends paid to the listed company’s public shareholders. It encompasses a broader set of payments. Another CNY6.185 billion appears in other financing payments, with the report identifying share repurchases as the principal explanation. [S02, pp.13,66]
The first half of 2026 again moves in the other direction. Cash and cash equivalents increased by CNY58.385 billion. Operating cash flow was positive CNY70.691 billion, investing cash flow was positive CNY25.641 billion, and financing cash flow was negative CNY37.944 billion, with a small exchange-rate adjustment completing the bridge. [S03, p.34]
The positive investing total is material. Investment-recovery receipts were CNY40.086 billion, against CNY13.750 billion of investment payments, alongside other investing items. It would be wrong to describe the entire CNY58.385 billion cash increase as cash generated by selling more liquor. Both operating financial movements and investing receipts participate in the explanation.
There is a further timing issue. Moving a financial instrument into or out of the cash-equivalent category can alter the presentation of cash and cash-flow movements without creating equivalent revenue or profit. The reports’ classification and maturity explanations need to be read together. The exact path of every instrument is not established by the selected rows, so this article does not assign a particular maturity to an unidentified placement.
Does the rest of the business look unchanged?
No. The bridge identifies the main arithmetic drivers of the operating cash-flow comparison; it does not establish that liquor demand, customer payments, sales channels, or working capital were unchanged. Several disclosed observations caution against that inference.
Cash received from selling goods and providing services increased from CNY182.645 billion in 2024 to CNY183.990 billion in 2025. In the first half of 2026 it increased from CNY95.087 billion to CNY98.422 billion. These are relevant customer-cash observations, distinct from deposits accepted by the finance subsidiary. They are not, however, the same measure as current-period revenue. [S02, p.64; S03, p.33]
Receipts can relate to earlier sales or future deliveries, and the receipt measure need not share revenue’s tax basis. A business can collect cash before recognizing revenue, recognize revenue before collecting cash, or change its use of payment instruments. Comparing sales receipts with revenue is a useful starting point, but a ratio alone does not settle collection quality.
Contract liabilities provide a specific counterweight. The June 2026 report shows CNY3.178 billion of contract liabilities, compared with CNY8.007 billion at the end of 2025, a decline of 60.31%. Moutai explains that marketing reforms changed sales methods and adjusted advance-payment policies. This is a business-related change that deserves attention in its own right. [S03, p.9]
A contract liability commonly represents consideration received before the related performance is completed. Its reduction can reflect delivery against earlier advances, changes in prepayment requirements, changes in order timing, or a combination of factors. The disclosed explanation supports a policy-related interpretation here, but a precise bridge between policy changes, orders, deliveries, and cash would require additional data.
The significance for this article is limited but important. A near-flat subtotal after removing two financial rows cannot establish stable customer prepayments. Increases in receipts and payments elsewhere can offset a decline in contract liabilities. An investor should retain the operational questions rather than let the finance-company explanation answer everything.
The parent-company cash-flow statement is not an automatic solution either. The standalone parent reported operating cash flow of CNY32.618 billion in 2025, versus CNY36.827 billion in 2024. It reported CNY15.225 billion in the first half of 2026, versus CNY8.196 billion in the prior half. These numbers describe one legal entity, not all consolidated liquor operations. [S02, p.66; S03, p.35]
Subsidiaries may sell, collect, purchase, or pay within the group. Standalone cash flows can include internal transactions that require elimination on consolidation. Replacing consolidated operating cash flow with the parent’s number would therefore omit activities and change the reporting boundary. A genuine liquor-business cash-flow analysis needs an appropriate segment or entity reconciliation, not a convenient substitute selected because it excludes the finance subsidiary.
Company explanations and competing interpretations
The strongest benign interpretation is that these movements reflect ordinary financial-business funding and treasury deployment. Deposits change, funds are placed for different periods, instruments mature, and the consolidated statements record the resulting flows. Moutai’s annual and interim explanations directly support this account. The sharp reversal between 2025 and the first half of 2026 also weakens a one-direction story that treats the annual decline as proof of deteriorating product cash collection.
This interpretation does not require assuming that every future period will reverse. It says the reviewed changes have disclosed financial-business drivers. Whether the funding and placement pattern is recurring, seasonal, or responsive to particular group needs would require a longer series and maturity information.
A second interpretation concerns reader understanding. Even properly disclosed financial activity can make a consolidated operating cash-flow ratio a poor shorthand for the product business. A liquor-focused investor might reasonably want a clearer reconciliation separating the financial subsidiary’s funding and deployment from product-related receipts and payments. This is a question about analytical usefulness, not an assertion that the company failed to provide the required accounting statements.
A third interpretation concerns liquidity dependence. Related-party deposit funding is concentrated, and cash assets sit in different categories and entities. If significant deposits became repayable before corresponding assets were available, liquidity management would matter. The reviewed reports do not show that this mismatch has occurred. Testing it would require contractual maturities, withdrawal terms, asset maturities, and entity-level liquidity information. Concentration alone does not supply those facts.
These interpretations can coexist. Financial deployment may be entirely ordinary; the headline may still be easy to misunderstand; and maturity information may still be needed for a complete cash assessment. There is no requirement to choose between “everything is fine” and “there is a crisis.” The evidence supports a narrower, more useful conclusion about what the reported cash-flow growth rate measures.
The report’s own explanations should remain central to that conclusion. Presenting the deposit mechanism as an undisclosed discovery would overstate the novelty. The independent contribution here is connecting the liability definition, consolidation perimeter, cash-flow signs, and cash composition, then reproducing the two-period bridge so that an ordinary reader can see the size of the effect.
The finance-company assessment supplies meaningful counterevidence
Moutai’s assessment of its finance company, published in August and based on June 30 information, reports assets of CNY157.136 billion, liabilities of CNY145.196 billion, and equity of CNY11.941 billion. Those are the finance company’s own figures, not another set of balances to add to the consolidated group. The report gives a capital-adequacy ratio of 20.94% and reports non-performing asset and loan ratios of zero. These are company-reported assessment figures, not an independent regulatory assurance or a guarantee of future outcomes. [S04, p.7]
The same assessment says the listed company had CNY30.145 billion deposited with the finance company and no loans from it. This deposit runs in the opposite direction from the external member deposits at the center of the article: it is an asset of the listed depositor and a liability of the receiving finance company. Within the listed consolidation perimeter, the corresponding internal balance is eliminated. Adding CNY30.145 billion to the CNY25.426 billion external related-party deposit table would mix the internal and external populations and misstate the consolidated obligation. [S04, p.8; S03, pp.97-98]
The company also says there had been no payment delays caused by inadequate liquidity and concludes that the financial-business risks were controllable. That conclusion matters. A discussion of concentrated deposits that omits it would give an unnecessarily one-sided account of the available record. The assessment supports the ordinary-treasury interpretation and weighs against presenting an actual liquidity failure as established. It does not provide the full withdrawal-and-asset-maturity ladder or convert the consolidated cash total into immediately distributable cash for the listed parent. The remaining question is about matching amounts, obligations, and timing, not disregarding the company’s positive assessment. [S04, p.8]
What would change the assessment?
A more granular finance-company liquidity schedule could supplement the June-end assessment with funding stability, withdrawal terms, and the maturities of corresponding assets. The assessment already supplies capital and liquidity counterevidence; the missing maturity detail should not be described as a failure to obtain or consider that assessment.
To assess distribution capacity, investors need to know which cash balances belong to the listed parent, operating subsidiaries, and finance company, what obligations attach to them, and which funds can move between those entities. Without that information, the consolidated total cannot be converted into an immediately distributable surplus.
A maturity schedule would help distinguish readily available balances from longer-dated placements and match those assets with deposit obligations. Average and peak deposit balances would supplement the June-end concentration snapshot. A large year-end or half-year balance can conceal substantial intra-period movement, but the reviewed endpoint tables do not establish that such movement occurred.
For the liquor business, a bridge linking sales receipts, payment instruments, contract liabilities, and channel-policy changes would be more informative than the consolidated operating cash-flow percentage. The June reduction in contract liabilities makes the prepayment policy a concrete follow-up question. A financial-business reconciliation cannot settle that operating question.
Later statements could show whether operating cash flow excluding the two specified rows continues to rise. Even a sustained increase would remain a partial adjustment, not a complete measure of cash generated by the liquor segment.
Questions investors should ask
- How much of each period’s consolidated operating cash-flow change comes from finance-company deposits and asset placements, and how much comes from other operating receipts and payments?
- Can the company provide a reconciliation for the liquor operations that preserves the correct consolidation boundary rather than substituting the standalone parent’s cash flow?
- What are the maturity and withdrawal characteristics of the related-party deposits, particularly the controlling group’s deposit balance?
- How do deposit obligations align with the finance company’s available cash, interbank assets, and longer-dated financial investments?
- Which cash balances belong to which legal entities, and what information is needed to assess distributions from those entities?
- How do changed advance-payment policies explain the decline in contract liabilities and the movement in customer cash receipts?
- What do subsequent finance-company assessments and announcements add to the position described in the three reports reviewed?
Conclusion
Moutai’s operating cash-flow surge is a reported fact. So is the deposit and placement mechanism that largely explains its year-on-year increase. Approximately 99.36% of the first-half increase can be reconciled to changes in two specified financial rows. That finding narrows what the headline can establish about cash generated by selling liquor; it does not deny that cash moved.
The related-party footnote supplies the crucial direction. The finance subsidiary accepts deposits from group members, creating liabilities. Consolidation brings the controlled subsidiary’s assets and liabilities into the listed group’s statements in full. A large consolidated cash total therefore needs to be read alongside depositor obligations, asset composition, and legal-entity boundaries.
The reviewed documents support this explanation and these follow-up questions. They do not establish cash misstatement, improper transfers to the controlling shareholder, or a liquidity crisis. The useful reading is more specific: understand the financial business before treating consolidated operating cash-flow growth as liquor cash conversion or consolidated cash as immediately distributable surplus.
Sources
Page references are physical PDF pages. Amounts are CNY unless otherwise stated. Tables in CNY billion are rounded; bridges use exact source amounts. S01-S04 identify issuer filings and a company assessment, not third-party allegations.
| ID | Original document and English description | Publication date | Principal locations | Link |
|---|---|---|---|---|
| S01 | Kweichow Moutai Co., Ltd. 2024 Annual Report | April 8, 2025 | pp.66-67: 2023 and 2024 consolidated cash-flow comparison | Issuer PDF |
| S02 | Kweichow Moutai Co., Ltd. 2025 Annual Report | April 17, 2026 | pp.6,13: results and explanations; pp.64-66: cash-flow statements; p.103: deposits accepted; p.116: cash composition; p.120: finance-company ownership; pp.131-132: related-party deposit definition and balances | Exchange PDF |
| S03 | Kweichow Moutai Co., Ltd. 2026 Interim Report | August 17, 2026 | p.5: results and explanation; p.9: contract liabilities; pp.33-35: cash-flow statements; p.82: cash composition; p.86: ownership; pp.97-98: related-party deposits | Issuer PDF |
| S04 | Risk Assessment of Guizhou Moutai Group Finance Co., Ltd. | August 15, 2026; board report dated August 13 | pp.7-8: financial position, capital, deposits, and company’s liquidity conclusion | Issuer filing PDF |
Disclaimer
This report is based on the cited public information available by the stated cutoff and is prepared for educational and investor-protection purposes. It is not investment, legal, or accounting advice, or a recommendation to buy, sell, or hold any security. Calculations and hypothetical examples explain the cash-flow mechanism; they do not restate Moutai’s accounts. Entity-level cash availability and maturity information remain unresolved in the materials reviewed. No misconduct is alleged unless a competent authority has made such a finding. Readers should conduct their own due diligence.