Offcn's Guarantee Total Counts Some Debts More Than Once
Why repeated support amounts and distinct financing constraints need separate readings.
- Company
- Offcn Education
- Ticker
- 002607.SZ
- Published
- September 11, 2026
- Information cutoff
- September 10, 2026
The detail
The 2025 annual report, p.58, states that the same credit or debt arrangements can be listed in both company-to-subsidiary and subsidiary-to-subsidiary categories, causing repeated counting. The reported CNY1.308 billion aggregate and 172.78% ratio are not a reconciled measure of distinct debt.
Why this matters
Offcn explicitly states that compound guarantees cause repeated counting in its headline totals. Debt, support obligations, restricted assets, and cash-flow bridges explain why the aggregate is not unique principal, while deduplication alone does not resolve the financial-flexibility question.
The detail
Offcn Education’s 2025 annual report gives a striking guarantee figure: CNY1.308 billion, equivalent to 172.78% of the company’s net assets. Immediately below the summary, however, the company explains that the aggregate contains repeated amounts. Some of the same credit facilities or debts appear both under guarantees provided by the listed company to subsidiaries and under guarantees provided by subsidiaries to other subsidiaries. Several headline totals consequently count those arrangements more than once. [S01, pp.57-58]
That explanation changes the first question an investor should ask. The question is not simply whether guarantees exceed equity. It is which number measures which exposure. A total of support arrangements is not necessarily a total of distinct debts, and a distinct debt is not necessarily an additional liability outside the consolidated accounts.
But the footnote does not make the support disappear. A single borrowing can tie together several legal entities, several properties, rental receivables, and shareholder support. Counting its principal once is appropriate when measuring group borrowing. Understanding every asset and entity supporting it is necessary when assessing financial flexibility. The same arrangement can be duplicated statistically while remaining economically consequential.
This article follows that distinction through the guarantee schedule, the restricted-asset note, the debt classifications, and the cash-flow statement. It finds a more useful concern than treating the largest aggregate as a loss estimate: how much freedom remains to refinance, release collateral, and allocate cash among obligations? The annual and full interim reports supply important parts of that map, including a restructuring that improved one borrowing’s terms and a subsequent increase in cash. They do not supply a complete, deduplicated debt-and-security reconciliation. Each balance below retains its own reporting date.
Executive summary
The company explicitly discloses the repeated counting. There is no basis here for alleging that it concealed the issue or that the published guarantee total should be read as CNY1.308 billion of independent new obligations. Nor is there a basis for simply dividing the figure by two. The repeated arrangements vary, and the reviewed schedule does not establish a single universal duplication factor. [S01, p.58]
The wider balance sheet nevertheless makes the security arrangements worth understanding. Assets subject to restrictions on ownership or use had a carrying value of CNY3.672 billion at the end of 2025, approximately 64.55% of total assets. That is a mixed accounting population, including restricted monetary funds and pledged or mortgaged non-cash assets. It is neither a cash balance nor a forecast loss. [S01, pp.7,21-22,166; calculation]
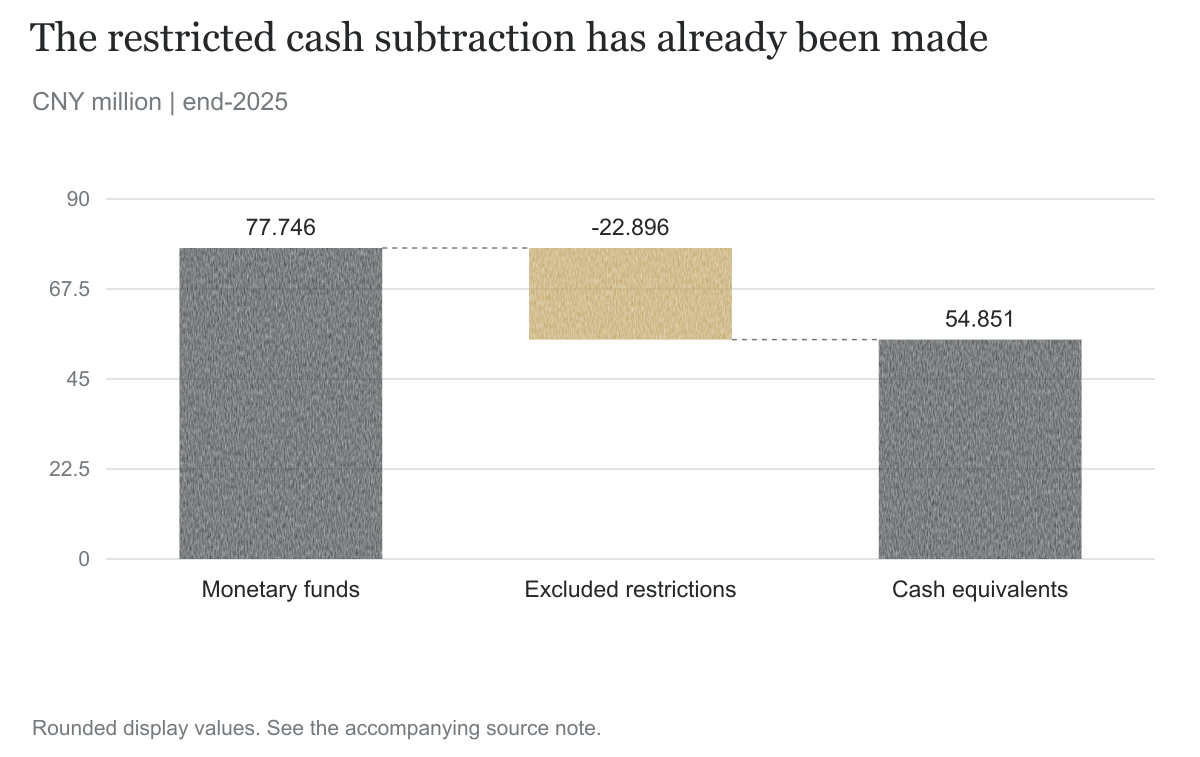
Available cash requires another distinction. Monetary funds were CNY77.746 million, but CNY22.896 million was excluded from cash and cash equivalents because of restrictions. The reported cash-and-equivalents balance was therefore CNY54.851 million. The exclusion has already happened; subtracting the restricted amount again would understate cash. [S01, pp.20,185]
Positive operating cash flow did not prevent cash from declining. In 2025, CNY422.591 million of operating cash flow and CNY13.245 million of net investing inflow were outweighed by CNY643.101 million of net financing outflow. The cash decline is explained by that bridge, not by an unexplained disappearance of operating receipts. [S01, pp.19-20,184]
There is also meaningful counterevidence. One CNY205.810 million debt was restructured with a longer repayment grace period and a lower rate, and the company reported compliance with that particular arrangement. The 2026 interim summary shows increases in revenue, attributable profit, and operating cash flow. Those developments matter, but they do not update every collateral or guarantee balance. The remaining disclosure question is the connection between distinct debts, support obligations, asset restrictions, and actual payment dates. [S01, p.217; S02, pp.1-2]
Background: a training business with a financing map
Offcn Education Technology Co., Ltd. is listed in Shenzhen under ticker 002607. Its annual report describes an education and training business with both face-to-face and online delivery. For an ordinary reader, that operating model is easier to picture than its financing structure: students purchase courses, the company provides teaching and related services, and the business receives and spends cash as those activities progress. [S01, pp.6,14]
The operating narrative in the 2025 annual report is one of a turning point and renewed expansion. The company describes changes to its organization and a shift toward expanding its teaching network. It also reports that revenue and attributable profit declined for the year. These statements are not mutually exclusive: a company can believe that newer initiatives are improving while its full-year comparisons remain weaker. The research question is whether the financing structure can accommodate the timing and cash requirements of that transition. [S01, p.14]
Three basic accounting ideas help explain why a guarantee table cannot answer that question alone. First, a consolidated group is a reporting boundary. The accounts combine controlled businesses and remove certain internal balances to show the group as an economic whole. That presentation does not mean the individual companies cease to exist as borrowers, property owners, or parties to financing arrangements.
Second, equity is an accounting residual: assets minus liabilities attributable to the relevant owners. It is not a cash reserve waiting to meet every obligation. A guarantee-to-equity ratio expresses scale against that residual. It does not tell a reader when a guarantee might be called, whether the supported borrowing is already recognized, or how much could be recovered from the borrower or collateral.
Third, a financing arrangement can have more than one form of support. A guarantee is a promise by a supporting party under specified terms. A mortgage or pledge links a particular asset or right to the financing. Those protections may support the same debt, but their practical implications differ. The borrower needs funds to pay; a guarantor may face a payment obligation under the agreement; an asset provider may face constraints on a property or right. The exact contractual consequences cannot be reconstructed from a summary table alone.
That is why the apparently simple ratio of 172.78% needs several layers of interpretation. It is a reported aggregate of support arrangements divided by net assets, with an explicit warning about repetition. It is not a direct measure of likely cash loss, unique principal, or off-balance-sheet debt. The annual report’s smaller explanatory paragraph is essential to understanding the larger number.
The documentary trail
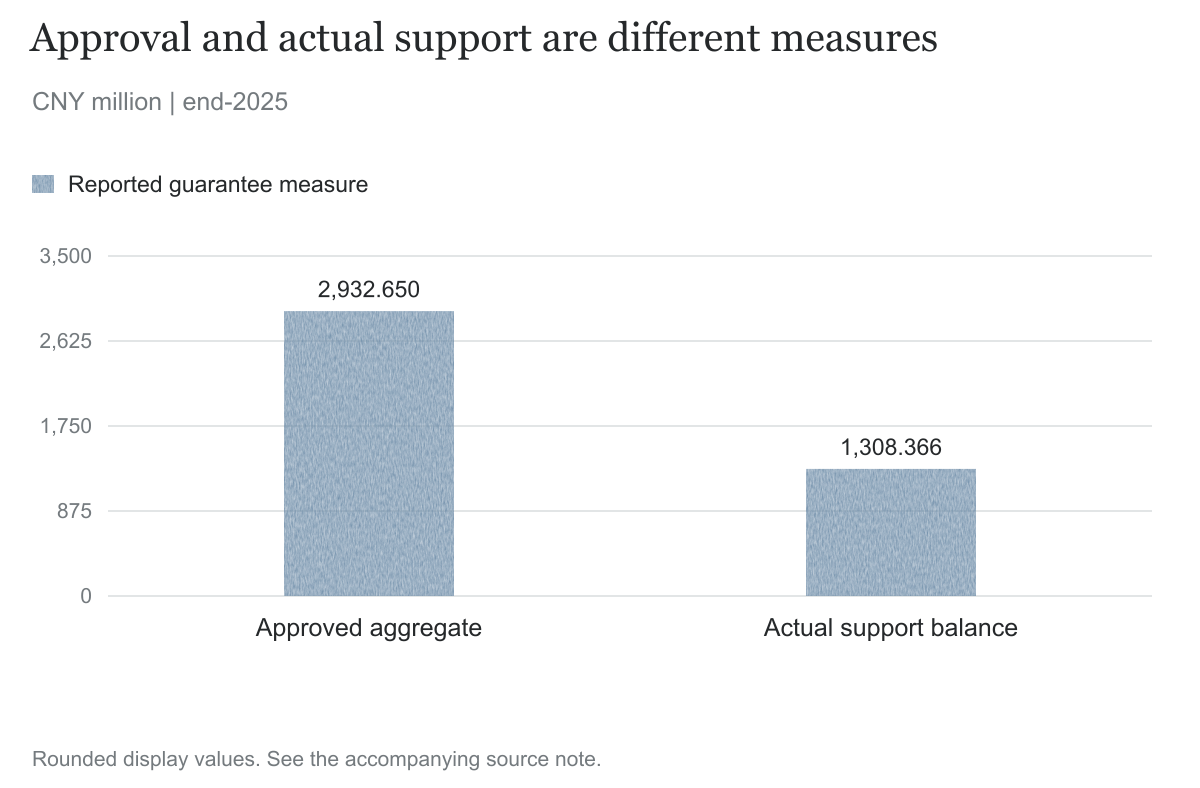
The core evidence appears in the major-guarantee section of the 2025 annual report, published on April 29, 2026. The schedule separates support provided by the listed company to subsidiaries from support provided by subsidiaries to other subsidiaries. On physical PDF page 54, the first category reports a year-end actual guarantee balance of CNY655.433 million. On page 57, the second category reports CNY652.933 million. The reported aggregate is CNY1,308.366 million. [S01, pp.54,57]
There is a small presentation point worth preserving rather than silently changing: adding the two displayed category values gives CNY100 more than the displayed aggregate. The report presents these figures in units of CNY10,000 and to two decimal places. This article retains the company’s reported total. The reviewed text does not establish the reason for the CNY100 difference, and that minor difference is not the analytical issue. The explicit repeated-counting explanation is. [S01, pp.54,57; calculation]
Page 58 states that the same credit or debt arrangements can be listed in both categories. The company says the repeated counting affects approved amounts, actual amounts arising during the period, year-end approved amounts, and year-end actual balances. It also explains its approach to reporting annual approvals and continuing balances, and says it did not provide guarantees beyond approved limits. That approval explanation must be considered alongside the duplication warning. [S01, p.58]
The report then identifies several compound-support arrangements with different borrowers and dates. The reader is not looking at one isolated guarantee accidentally entered twice. The note describes a method of financing involving different combinations of guarantees and asset security. Its examples include support from the listed company, subsidiaries, individuals, and other relevant parties. [S01, p.58]
Later financial-statement notes provide additional detail on the underlying financing. Pages 212-213 describe, among other arrangements, a CNY205.810 million borrowing with the listed company and a subsidiary involved as debtors, supported by guarantees, property security, rental-receivable security, and a shareholder share pledge. Page 217 explains the related restructuring, including the creditor transfer, altered repayment terms, lower financing rate, and accounting gain. These are different descriptions of connected arrangements, not automatically separate amounts to add together. [S01, pp.212-213,217]
The full 2026 interim report and its summary were published on August 27. The summary supplies improved headline operating results, while the full report updates guarantees, restricted assets, and cash. The detailed June-end notes belong in this review rather than leaving the analysis at December. They still do not make the reporting-date balances equivalent to verified October balances. A May investor-relations record adds the company’s explanation of ongoing restructuring and creditor negotiations. [S02, pp.1-2; S03, pp.33-34,133-134,151; S04, p.4]
How the mechanism works
One borrowing, several forms of support
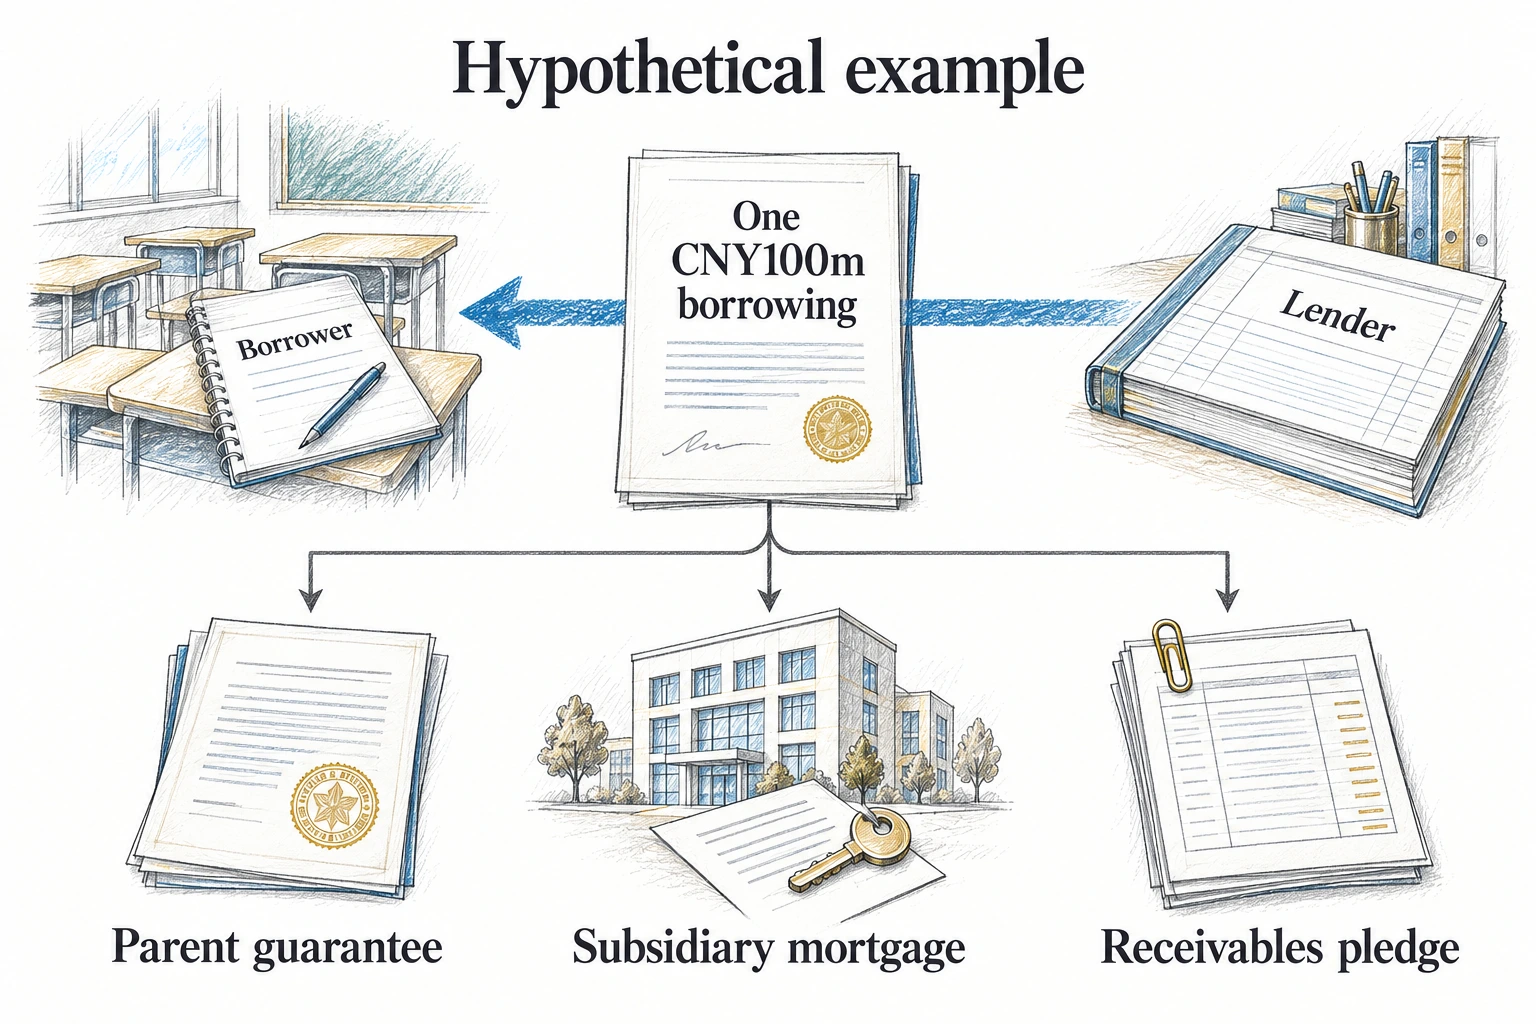
Consider a hypothetical group borrowing CNY100 million. The operating subsidiary is the borrower. The listed parent gives a guarantee, another subsidiary mortgages a building, and a third subsidiary pledges rental receivables. Each supporting arrangement may refer to the same borrowing and may have its own limit, duration, and contractual conditions.
If a disclosure system lists the parent support in one category and subsidiary support in another, an aggregate of listed support amounts can exceed CNY100 million. The group has not necessarily borrowed a second CNY100 million merely because more than one entity supports the first borrowing. A count of documents, providers, or maximum support amounts is not a count of independent advances of cash.
However, the building and receivables are not irrelevant duplicates. They are different resources connected to the same financing. Depending on the agreements and events, the arrangement can affect the group’s ability to use those resources for another loan, sell an asset free of security, redirect rental cash, or release a guarantor. Those effects cannot be calculated by dividing the aggregate support figure by the number of providers.
The example is only an explanation of the measurement problem. It does not estimate Offcn’s actual recoveries, contractual liability, enforcement sequence, or default probability. Its purpose is to show why two separate analyses are needed: deduplicate the debt for a borrowing total, but retain the security relationships for a financial-flexibility assessment.
The tempting but unsupported halving exercise
Offcn’s two principal category balances are similar, which makes a shortcut attractive. A reader might remove the subsidiary category and treat the remaining parent category as the true total. Another might divide CNY1.308 billion by two. Neither step is supported by the reviewed evidence.
The duplication warning identifies overlaps, not a complete loan-by-loan reconciliation. Some arrangements have different support providers, some may have different limits, and financing balances can change after the original support is put in place. A parent guarantee amount is not necessarily the unpaid principal at the reporting date. An asset-security amount is not necessarily that asset’s realizable value. The two category totals are not interchangeable just because their magnitudes are close.
The better request is a schedule organized by distinct debt or facility, with outstanding principal shown once and the supporting parties shown alongside it. The schedule should also identify whether a number is a facility limit, original financing amount, outstanding borrowing, actual guarantee balance, or maximum contractual support. Without those fields, apparent arithmetic precision can create false economic precision.
Approval is not utilization
The reported year-end approved guarantee amount was CNY2.933 billion, while the reported year-end actual guarantee balance was CNY1.308 billion. Both aggregates are subject to the company’s repeated-counting explanation. Approved support, actual support outstanding, and funds borrowed are nevertheless different concepts even before removing overlaps. [S01, pp.57-58]
An approval can authorize a future arrangement without generating an immediate cash receipt or payment. An actual guarantee can remain in place after a borrowing has partly amortized. A facility can permit drawings that have not yet occurred. The labels matter because using an approved maximum as current debt can materially overstate the amount in use.
The reverse shortcut is also unreliable. A balance below approved capacity does not establish plentiful financing headroom. Approval is an internal authorization, while obtaining financing can still depend on lender consent, asset availability, pricing, and the borrower’s condition. The report’s statement about not exceeding approval limits answers an authorization question. It does not by itself answer the liquidity question.
What the numbers show
A three-year operating comparison
The annual report contains the following comparable three-year headline series. The first-half figures are considered separately rather than combined with full years.
| Year | Revenue, CNY million | Attributable profit or loss, CNY million | Operating cash flow, CNY million |
|---|---|---|---|
| 2023 | 3,086.320 | -209.430 | -800.065 |
| 2024 | 2,626.625 | 183.679 | 556.831 |
| 2025 | 2,236.932 | 48.891 | 422.591 |
Source: S01, p.7. The table uses the 2025 report’s comparative figures and does not imply that a complete 2021-2025 historical review has been performed.
The series contains both recovery and weakness. Operating cash flow moved from a substantial negative amount in 2023 to positive amounts in 2024 and 2025. Attributable profit also remained positive in the two later years. Those observations weaken an argument that the company simply continued the same pattern of cash losses throughout the period.
At the same time, revenue declined in each of the two annual comparisons shown. In 2025 it fell 14.84%, while attributable profit fell 73.38% and operating cash flow fell 24.11%. These are distinct measures with different drivers. The company explains that the prior year’s profit benefited from recovering an amount for which a bad-debt allowance had previously been recognized. A large profit decline therefore cannot be treated as an equally large deterioration in recurring trading performance without examining that comparison. [S01, pp.7,14]
The guarantee analysis should use this operating context without converting it into a prediction. Positive cash generation provides a source of support for obligations. Falling annual revenue can make the scale and timing of future receipts important. Neither fact determines whether a particular borrowing will be repaid, refinanced, or secured on revised terms.
The ratio is a scale indicator, not a loss estimate
The reported CNY1,308,366,300 guarantee aggregate divided by CNY757,235,343.61 of attributable net assets gives approximately 172.782%, reproducing the company’s rounded 172.78% figure. The denominator therefore explains the published scale. The numerator still carries the duplication qualification. [S01, pp.7,57-58; calculation]
This calculation does not prove that equity would be exhausted if every listed support arrangement were called. That conclusion would require information about distinct obligations, contractual limits, collateral proceeds, recoveries, and liabilities already reflected in the accounts. The guarantee ratio provides none of those assumptions on its own.
Nor should the aggregate be added automatically to consolidated borrowings to produce a supposedly more complete debt figure. If a consolidated subsidiary’s borrowing is already recorded as a group liability, the parent’s support of that borrowing does not create a second independent receipt of funds. The obligations of individual parties remain worth examining, but an arithmetic addition can double-count the underlying financing as well as double-count the support.
The ratio is most useful as an instruction to open the notes. It signals that the support arrangements are large relative to the accounting equity base. The next step is to determine the underlying debt population and where the financing constrains resources, rather than converting a scale comparison into a forecast of losses.
Restricted assets: a different measure of the same financing environment
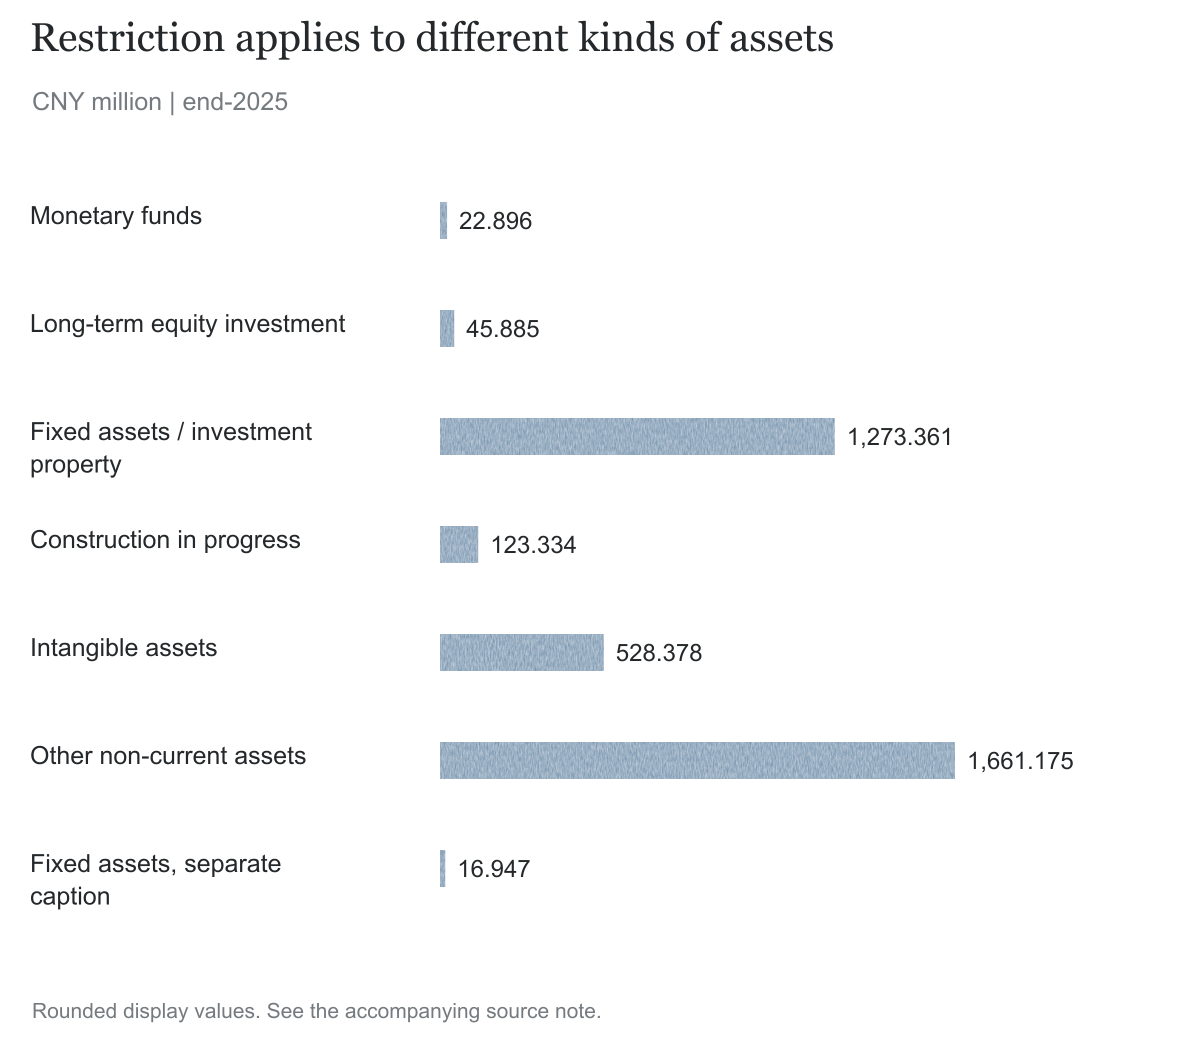
The restricted-asset note reports both gross balances and carrying values. For comparison with total assets, the carrying value is the relevant accounting measure used here. It reflects recognized book values, not lender valuations or forced-sale proceeds.
| Asset category subject to restriction | End-2025 carrying value, CNY million |
|---|---|
| Monetary funds | 22.896 |
| Pledged long-term equity investment | 45.885 |
| Fixed assets and investment property, combined category | 1,273.361 |
| Construction in progress | 123.334 |
| Intangible assets | 528.378 |
| Other non-current assets | 1,661.175 |
| Separately listed fixed assets | 16.947 |
| Total | 3,671.975 |
Source: S01, pp.21-22,166. Categories follow the filing; the table is not a valuation or a loan-by-loan collateral allocation.
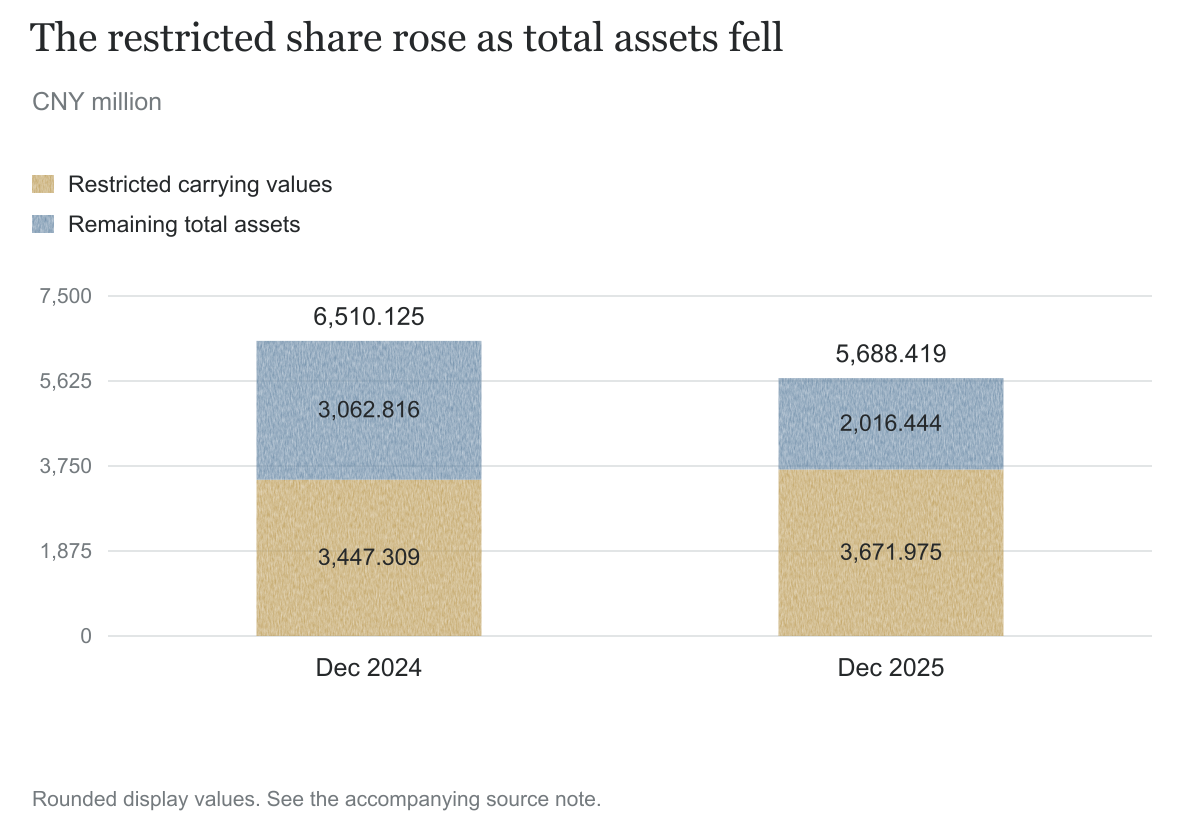
At December 31, 2024, the equivalent carrying-value total was CNY3.447 billion against total assets of CNY6.510 billion, or approximately 52.95%. At December 31, 2025, it was CNY3.672 billion against CNY5.688 billion, or approximately 64.55%. Both the increase in restricted carrying value and the reduction in total assets contribute to the higher proportion. It would be incomplete to describe the percentage change solely as newly mortgaged property. [S01, pp.7,21-22,166; calculation]
These restrictions do not all have the same meaning. A frozen monetary balance differs from a mortgage over a property that can still support operations. A pledge of an investment differs from security affecting a receivable. The table groups restrictions on ownership or use, not assets already lost to creditors. Its total cannot be converted into a cash amount unavailable for payroll.
The large other-non-current-asset category also deserves a careful reconciliation. The report separately shows substantial fixed-asset prepayments within other non-current assets, but the aggregate notes do not provide a complete asset-right-by-debt bridge here. A reader should ask which contractual or property rights are restricted, how they relate to the reported balances, and when they can be released. Similar numbers in different notes are not sufficient to establish identical legal rights or counterparties. [S01, pp.165-166]
The practical question is financing flexibility. If an asset is already committed to one facility, using it for additional borrowing or selling it may depend on the existing agreement and creditor consent. But the reported carrying value alone does not reveal remaining borrowing capacity. A property can have equity above the secured debt, or a security package can cover assets whose value is difficult to realize. Those possibilities require information not present in the aggregate.
Cash: the subtraction has already been made
At the end of 2025, monetary funds of CNY77.746 million included CNY22.896 million subject to restrictions. The cash-flow note excludes that amount and reports cash and cash equivalents of CNY54.851 million. The annual report describes the restricted monetary population as including judicial or limit-related freezes and other payment-use restrictions. It does not justify treating every yuan as a separately verified judicial seizure. [S01, pp.20,166,185]
The exact bridge is:
CNY77,746,069.61 - CNY22,895,563.14 = CNY54,850,506.47.
Approximately 29.45% of monetary funds falls within that excluded population. This is a proportion of monetary funds, not a proportion of total assets and not an additional deduction from the reported cash balance. Using the cash-flow balance and then deducting restricted monetary funds once more would count the same limitation twice. [S01, p.185; calculation]
The remaining cash balance is a group accounting amount. It does not specify how much is held by each borrower or guarantor, what transfers between entities are feasible, or the daily payment calendar. Those questions become important when multiple companies support a facility. A consolidated sum may be economically informative while still being insufficient to assess the immediate position of a particular debtor.
Current financing is broader than short-term borrowing
The short-term-borrowing line was only CNY21.181 million at December 31, 2025. Reading that line alone would miss substantial financing classified elsewhere. The current portion of non-current liabilities was CNY797.876 million, comprising long-term borrowings, long-term payables, and lease liabilities falling into the current category. [S01, pp.166,171]
| Selected current financing category | End-2025 amount, CNY million |
|---|---|
| Short-term borrowings | 21.181 |
| Current portion of long-term borrowings | 486.784 |
| Current portion of long-term payables | 102.087 |
| Current portion of lease liabilities | 209.005 |
| Selected total | 819.057 |
Source: S01, pp.166,171. This is a selected financing-liability sum, not all current liabilities or all future cash payments.
The cash-and-equivalents balance represents approximately 6.70% of that selected total. The calculation is a static comparison between year-end balances. It does not assume all liabilities are payable on the same day, that no new operating cash will be generated, or that refinancing is impossible. It also excludes other obligations. Its value is to show why the short-term-borrowing headline is an inadequate summary, not to calculate a certain funding shortfall. [S01, pp.166,171,185; calculation]
The same care is needed with long-term payables. The note shows CNY25.022 million of sale-and-leaseback financing payables and CNY142.577 million of factoring-business payables before deducting CNY102.087 million classified as current. The remaining non-current balance is CNY65.512 million. Treating that remainder as the entire financing would omit the current component; adding the entire pre-deduction amount to the current component would duplicate it. [S01, p.173]
A narrower borrowing-only calculation adds short-term borrowings, current long-term borrowings, and non-current long-term borrowings to approximately CNY1.209 billion. That excludes lease liabilities, the financing payables just discussed, and other possible payment obligations. It should be labeled borrowing-only rather than total debt. Different totals can all be arithmetically correct while answering different questions. [S01, pp.166,171; calculation]
Positive operating cash, lower ending cash
The annual cash-flow bridge is especially useful because it shows the direction of cash rather than simply comparing profit and a year-end balance.
| 2025 cash-flow component | CNY million |
|---|---|
| Net operating cash inflow | 422.591 |
| Net investing cash inflow | 13.245 |
| Net financing cash outflow | -643.101 |
| Change in cash and cash equivalents | -207.265 |
Source: S01, pp.19-20,184. The unrounded figures reconcile exactly.
Operating inflows totaled CNY2.189 billion and operating outflows CNY1.767 billion. Their difference was positive. Financing outflows nevertheless exceeded financing inflows by a larger amount. The cash-and-equivalents balance fell from CNY262.115 million to CNY54.851 million. There is no need to infer missing cash to explain that movement. [S01, pp.19-20,184-185]
The operating-cash-flow reconciliation also prevents a simplistic explanation that all the inflow came from new student advances. It starts from consolidated net profit of CNY48.797 million, not the CNY48.891 million attributable-profit figure. It includes non-cash adjustments, a CNY123.221 million contribution from a decrease in operating receivable items, and a CNY248.496 million reduction from decreases in operating payable items. These are accounting reconciliation categories, not a direct statement of the cash contribution of one course or customer cohort. [S01, pp.183-184]
Two liability balances reinforce the need for that distinction. Contract liabilities were CNY1.650 billion, while a separate refund-liability category was CNY508.262 million. A training-service obligation is not identical to an immediate obligation to repay a lender. Nor should these balances automatically be combined as if every amount were an immediately payable refund. Their cash implications depend on service delivery, refund terms, and settlement timing. [S01, pp.20,171]
This is why operating cash generation is important evidence but not the final answer to the guarantee question. The company must allocate cash among operating commitments, financing payments, and other obligations. The year-end balance reflects the net outcome of those movements, while the security map can affect the options available when their timing does not align.
Shareholder support is also a financing relationship
Within financing cash outflows, the report identifies CNY316.382 million paid in respect of shareholder loans during 2025. That is approximately 47.41% of the CNY667.286 million gross financing outflow. The figure should not be confused with the CNY643.101 million net financing outflow, whose denominator already subtracts financing inflows. [S01, pp.19,183; calculation]
The related-party note also identifies an interest-free borrowing balance from Lu Zhongfang of CNY34.158 million at year-end. That balance is outstanding support, not a statement that exactly CNY34.158 million of new funding arrived during the year. A closing balance measures a position; a cash-flow payment measures a movement. [S01, p.213]
Repaying a shareholder loan reduces a liability and consumes cash. The cash-flow note identifies a material use of cash, but does not explain the reasons for each repayment decision. The terms and payment schedule are needed to assess how those repayments affected liquidity.
It is also useful to distinguish shareholder financing from equity. Interest-free support can help liquidity without becoming permanent capital. A shareholder guarantee or share pledge may help obtain financing without putting cash directly into the listed company’s bank account. Those arrangements can have genuine value, but their contribution and duration depend on their terms rather than the reassuring word support alone.
What the debt restructuring changed
The CNY205.810 million arrangement provides a concrete example of how several protections can accompany one financing. The annual report says a creditor transfer and debt restructuring were agreed in October 2025 as a connected transaction. The debt’s repayment grace period was extended to 36 months and its rate changed from 9.5% to 7.01% per year. The listed company remained a debtor, and its wholly owned Xiangtan subsidiary became a joint debtor under the described arrangement. [S01, p.217]
The support package included property mortgages from the company and subsidiaries, guarantees, and pledges. The related-party financing note further identifies security over rental receivables and a shareholder pledge of Offcn shares. The disclosures should be read as a connected financing map, not as an instruction to multiply CNY205.810 million by the number of supporting parties. [S01, pp.213,217]
The improvement in terms is substantive. A longer repayment grace period can help align obligations with future resources, and a lower interest rate can reduce financing cost. The rate reduction is 2.49 percentage points. Under a purely illustrative assumption that the original CNY205.810 million principal stayed outstanding for a full year, the rate difference would correspond to approximately CNY5.125 million of interest. Actual payments depend on the outstanding balance, timing, compensation, and other terms, so that illustration is not a calculation of realized savings. [S01, p.217; hypothetical calculation]
The report recognizes a restructuring gain of CNY5.259 million and classifies it as non-recurring. That gain is not identical to the illustrative interest difference and is not evidence that the principal was erased. An accounting gain arising from altered financing terms should not be described as cash received from a cancelled debt. The company still describes repayment obligations under the revised agreement. [S01, p.217]
The company says it performed the relevant principal and restructuring-compensation payments normally at December 31, 2025, and had paid according to the repayment agreement by the financial report’s approval date. That is evidence in favor of this arrangement’s functioning as intended. It should not be replaced by a presumption that restructuring automatically means continuing default. [S01, p.217]
The statement is limited to this debt. Elsewhere, the same report describes another bank-related dispute with principal, interest, and penalty amounts still unpaid at year-end. The reported remaining principal in that separate matter was CNY412.950 million. It would therefore be inaccurate to convert the positive compliance statement for the restructured debt into a statement that the entire group had no repayment disputes or unpaid balances. Those amounts also require reconciliation before adding them to accounting borrowing totals. [S01, p.215]
The deeper question is what the improved terms require in return. Multiple supporting assets may help a creditor accept a longer timetable and lower rate, while limiting the resources available for other financing. That trade-off can be sensible. Assessing it requires the payment schedule, security coverage, and release conditions. Neither the accounting gain nor the duplication footnote answers those questions by itself.
Company explanations and competing interpretations
The strongest benign interpretation begins with something the company has already done: it has explained the repeated counting. The aggregate is presented with a qualification rather than left as an unqualified measure of distinct debt. The report also states that guarantees did not exceed approved limits. An analysis that omits those explanations would turn a disclosed measurement issue into an unsupported accusation. [S01, p.58]
Compound support may also have a commercial purpose. Different group entities hold different properties, receivables, or operations. Bringing them into one security package can help obtain financing on terms unavailable to a borrower alone. The restructured debt’s lower rate and longer grace period are actual disclosed improvements, not merely a hypothetical management defense. [S01, pp.213,217]
The operating evidence further qualifies the concern. After negative operating cash flow in 2023, Offcn reported positive operating cash flow in both 2024 and 2025. The 2026 interim summary then showed revenue of CNY1,169.312 million, attributable profit of CNY73.224 million, and operating cash flow of CNY287.883 million. All three rose compared with the first half of 2025. [S01, p.7; S02, pp.1-2]
| First-half comparison | 2025, CNY million | 2026, CNY million | Reported change |
|---|---|---|---|
| Revenue | 1,155.239 | 1,169.312 | +1.22% |
| Attributable profit | 61.784 | 73.224 | +18.52% |
| Operating cash flow | 272.743 | 287.883 | +5.55% |
Source: S02, pp.1-2. These half-year figures do not replace year-end collateral, cash, or maturity disclosures.
Those improvements make an important difference to the narrative. A borrowing structure can become easier to manage if operating resources improve and creditors cooperate. It would be unreasonable to ignore that possibility simply because the year-end cash balance was small. The cash comparison is dated and static, whereas operations and financing continue after year-end.
The competing interpretation concerns flexibility rather than a guessed default. The restricted-asset population is large relative to total assets, and the current financing categories extend well beyond short-term borrowing. The company can generate positive operating cash while ending the year with much less cash after financing payments. These conditions make a transparent schedule of payments, collateral releases, and refinancing resources useful, even when the guarantee aggregate is overstated as a measure of unique debt.
The two interpretations can coexist. Security may improve access to funding while committing assets. Repayment may reduce debt while lowering current cash. A restructured facility may be compliant while a separate dispute remains unresolved. A balanced assessment needs these separate facts, rather than forcing the entire group into one label of recovery or deterioration.
The full interim report adds improvement and continuity
At June 30, the reported aggregate guarantee balance was CNY1,260.859 million, with a disclosed ratio to net assets of 151.83%, compared with 172.78% at year-end. The report retains the explicit explanation that compound arrangements are counted repeatedly across the relevant categories. The lower total is useful subsequent evidence, but it remains a repeated-counting total. Dividing it by two or treating its entire decline as repayment of unique principal would still lack the transaction-level support required for that calculation. Changes in the numerator and net-asset denominator also both matter to the percentage comparison. [S03, pp.33-34]
The restricted-asset note shows why more than one measure is needed. Its aggregate gross carrying amount increased slightly, from CNY4,246.027 million to CNY4,247.227 million, while its net carrying value fell from CNY3,671.975 million to CNY3,638.882 million. The exact gross increase was CNY1,199,775.66; the exact net decline was CNY33,093,098.10. A decline in the net amount does not necessarily mean that equivalent security was released. Depreciation and changes in the asset population can alter carrying values without producing a matching release of a mortgage or pledge. The note must be read with actual release terms rather than used as a cash-recovery estimate. [S03, pp.133-134; calculation]
Cash and cash equivalents improved more clearly: the balance rose from CNY54.851 million to CNY139.191 million, an increase of CNY84.340 million. That is a meaningful change in the disclosed cash measure, and it qualifies a year-end-only account of cash pressure. It is not the same as all monetary funds, and it does not by itself establish that every borrower has discharged its obligations or that every restricted asset is available for refinancing. [S03, p.151]
In May, management described partial debt restructuring with longer repayment terms and lower interest, continuing creditor negotiations, and work to activate assets and reduce debt pressure. The explanation is consistent with treating the disclosed restructuring benefits as real rather than dismissing them. Its scope remains partial: a statement about progress is not a list of every settlement or security release. Read together, the cash increase, improved operating results, and lower reported guarantee ratio strengthen the positive side of the record, while the continuing repeated-counting explanation preserves the need for a loan-by-loan map. [S04, p.4; S02, pp.1-2; S03, pp.33-34,151]
What remains unresolved
The missing schedule would start with each distinct debt, then show its remaining principal, support limits, and providers. The annual report explains the repeated counting but does not supply that deduplicated total. A blanket percentage reduction cannot produce it.
A second gap concerns resources. The restricted-asset total provides accounting categories, not a map of creditor priority, lender valuations, remaining security capacity, or release conditions. It is not clear from the aggregate how repaying a particular amount changes the restrictions on a particular property or right. Knowing that relationship would help explain whether debt reduction releases meaningful flexibility or merely reduces one of several claims on the same asset.
A third gap concerns the calendar. Year-end cash and current-liability balances show scale, but they do not supply a monthly cash budget for each debtor. Operating receipts, service costs, refunds, financing installments, and refinancing decisions occur at different times. The risk depends on how those flows interact, not only on the ratio of two balances at one date.
The full interim report updates guarantees, restricted assets, and cash to June. Follow-up searches covered CNINFO announcement titles and investor-relations records dated March 1 through September 10, 2026, with selected originals reviewed in full. The search did not cover every announcement on every platform. What remains missing is a schedule linking each distinct debt to its maturity, collateral, and any subsequent release of security.
A low total of distinct debt, substantial collateral releases, available financing, or stronger cash at the relevant borrowers would ease the concern. Continuing restrictions or repayment dates that cannot be matched with available cash would make it more pressing. Those outcomes remain to be established.
Questions investors should ask
- What is the year-end outstanding principal of each distinct debt appearing in the compound-guarantee schedule, counted once?
- For each debt, which figures are facility limits, original amounts, actual guarantee balances, or maximum support obligations?
- Which companies are borrowers, joint debtors, guarantors, or providers of asset security, and where is their cash held?
- Which restricted assets support which financing, and what repayments or conditions release them?
- How do the current portions of borrowings, factoring, sale-and-leaseback financing, and leases translate into payment dates?
- What did the CNY205.810 million restructuring change beyond the rate and grace period, including compensation and continuing security?
- How do the improved June cash balance and lower reported guarantee ratio connect to specific repayments, refinancing arrangements, and security releases?
- Can the company reconcile its positive operating cash generation with the cash allocated to financing and other commitments?
Conclusion
The most useful sentence in Offcn’s guarantee disclosure is the one warning that the aggregate counts some arrangements repeatedly. It prevents a large percentage from being mistaken for a precise measure of independent debt or likely losses. That correction deserves to be made clearly.
It is not, however, a reason to stop reading. The same annual report shows multiple entities and assets supporting financing, a substantial population of restricted assets, financing obligations outside the short-term-borrowing line, and a cash decline that financing payments explain. The restructuring and subsequent operating improvement provide genuine counterevidence, while leaving the detailed resource and maturity map incomplete.
The investor-protection question is therefore narrower and more practical than whether the biggest guarantee number looks alarming. It is whether readers can move from a repeated aggregate to distinct debts, and then from those debts to the companies, assets, and cash flows supporting them. Until that reconciliation and the latest-period update are available, the evidence supports a financial-flexibility question, not a conclusion of misconduct or a prediction that any guarantee must be enforced.
Sources
References use physical PDF pages. Tables round to CNY million. The original guarantee schedule uses CNY10,000; reported totals are retained rather than silently corrected. The full interim report’s cited physical pages are one higher than its printed page numbers.
| ID | Original title and English description | Publication date | Principal locations | Link |
|---|---|---|---|---|
| S01 | Offcn Education Technology Co., Ltd. 2025 Annual Report | April 29, 2026 | pp.6-7: company and three-year results; p.14: company explanations; pp.19-22: cash flow and restrictions; pp.53-58: guarantees and repeated-counting explanation; p.70: audit type; pp.165-166: non-current assets and restrictions; pp.171,173: financing classifications; pp.183-185: financing cash payments, operating reconciliation, cash composition; pp.212-213,217: support and restructuring; p.215: separate bank dispute | Issuer filing PDF |
| S02 | Offcn Education Technology Co., Ltd. 2026 Interim Report Summary | August 27, 2026 | pp.1-2: operating results and comparative figures; p.1: summary scope | Issuer filing PDF |
| S03 | Offcn Education Technology Co., Ltd. 2026 Interim Report | August 27, 2026 | pp.33-34: guarantees and repeated-counting explanation; pp.133-134: restricted assets; p.151: cash and cash equivalents | Issuer filing PDF |
| S04 | Investor Relations Activity Record | May 15, 2026 | p.4: company’s restructuring and creditor-negotiation explanation | Issuer filing PDF |
Disclaimer
This report is based on the cited public information available by the stated cutoff and is prepared for educational and investor-protection purposes. It is not investment, legal, or accounting advice, or a recommendation to buy, sell, or hold any security. Hypothetical examples do not estimate Offcn’s actual exposure, contractual outcomes, or default probability. A complete loan-level reconciliation and security terms remain unavailable in the materials reviewed. No misconduct is alleged unless a competent authority has made such a finding. Readers should conduct their own due diligence.