Sungrow's Warranty Provision Has a Remaining-Months Assumption
How an estimate for products still under warranty connects past sales, future service costs, and reported margins.
- Company
- Sungrow
- Ticker
- 300274.SZ
- Published
- September 21, 2026
- Information cutoff
- September 20, 2026
The detail
The 2025 annual report, p.193, carries CNY5.569 billion of assurance-warranty provisions based on remaining warranty months and an average service rate. The 2024 report, p.161, separately moves CNY2.295 billion of 2023 warranty expense from selling costs to cost of sales.
Why this matters
Sungrow estimates warranty obligations from products still covered, remaining months, and an average service rate. The closing balance, an expense reclassification, retention assets, and strong cash resources explain why investors need a cohort and movement bridge before judging product economics or future service costs.
Review scope
Information cutoff: September 20, 2026. The review uses the public disclosures cited below and dated index entries within this boundary; later disclosures are outside its scope.
The detail
Below a CNY5.569 billion assurance-warranty provision, page 193 of Sungrow’s 2025 annual report describes how the closing estimate is calculated. The company considers products still within their warranty period, their remaining warranty months, and an average after-sales service cost rate. It is a short explanation of a substantial liability whose eventual cost depends on products sold in earlier periods as well as the latest year. [S01, p.193]
The detail changes the question an investor should ask. The balance does not simply measure this year’s repairs. Nor is it a cash account set aside for customers. It is an estimate of remaining service obligations. The size and age of the covered product population, the cost assumption, and the amount of warranty time still to run can all matter. The published explanation identifies those inputs but does not quantify them sufficiently for a reader to reconstruct the estimate.
The first-half 2026 report retains the method and raises the warranty balance to CNY5.683 billion, while revenue fell 28.99% from the prior first half. The measures cover different timeframes: the provision includes obligations on products sold before the current period, while revenue records current-period sales. A slowdown therefore need not immediately reduce the warranty balance. [S02, pp.9,171]
A second footnote makes the analysis more useful than a headline comparison. In 2024, Sungrow reclassified assurance-warranty expenses into cost of sales and adjusted comparative figures. For 2023, CNY2.295 billion moved from selling expenses to cost of sales. That amount differs from the CNY1.526 billion net increase in the warranty-related provision during 2023. The difference demonstrates why a closing-balance movement should not be treated as the year’s warranty expense. It does not identify how much repair cash was paid. [S03, p.161; S03, p.194; S04, p.158]
Executive summary
Sungrow’s provision estimates costs that will arise after the sale. If actual service costs differ from those estimates, the difference can affect later earnings. The filings reviewed do not establish that the provision is inadequate; they leave a question about how the estimate is calculated and tested against experience.
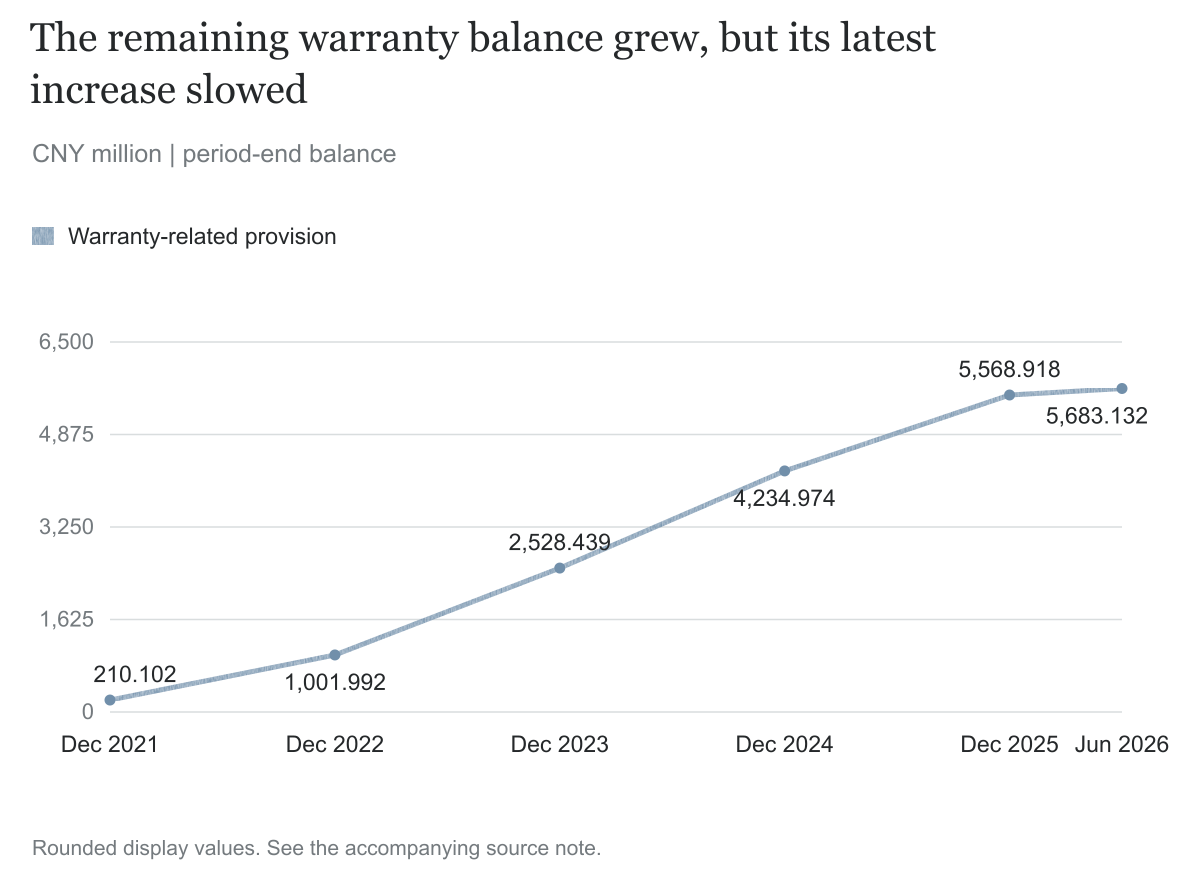
The warranty-related balance increased from approximately CNY1.002 billion at the end of 2022 to CNY2.528 billion in 2023, CNY4.235 billion in 2024, and CNY5.569 billion in 2025. It then rose another CNY114.2 million in the first half of 2026. Earlier reporting used an after-sales service cost caption; later reporting uses assurance-type warranties. The method description remains based on products within warranty, remaining months, and an average service rate. [S04, p.158; S03, p.194; S01, p.193; S02, p.171]
Growth and changing business composition offer reasonable explanations for a larger covered product population. The company itself connected the increase in its provisions to inverter and energy-storage business growth. Its investor communications emphasize reliability and localized after-sales service as part of the commercial offering. Those explanations should be examined alongside the numbers, not dismissed because a liability is large. [S03, p.194; S04, p.158; S05, p.3]
A full reconciliation would explain how the provision changed: new charges, costs incurred, releases, and other movements between the opening and closing balances. It would also show the cost assumptions and remaining warranty periods for different products or regions. Customer retentions are separate assets, not a fund for paying these costs. The 2024 expense reclassification affects gross-margin comparisons, while leaving aggregate profit unchanged through the two reclassified lines.
Strong cash generation is substantive counterevidence to an immediate liquidity warning. Sungrow reported CNY16.918 billion of operating cash flow in 2025 and CNY30.861 billion of cash and cash equivalents at June 2026. That financial capacity does not prove the estimate will cover every future service cost. It does mean this analysis should focus on estimation transparency and product economics rather than predict a near-term inability to pay. [S01, p.9; S02, p.179]
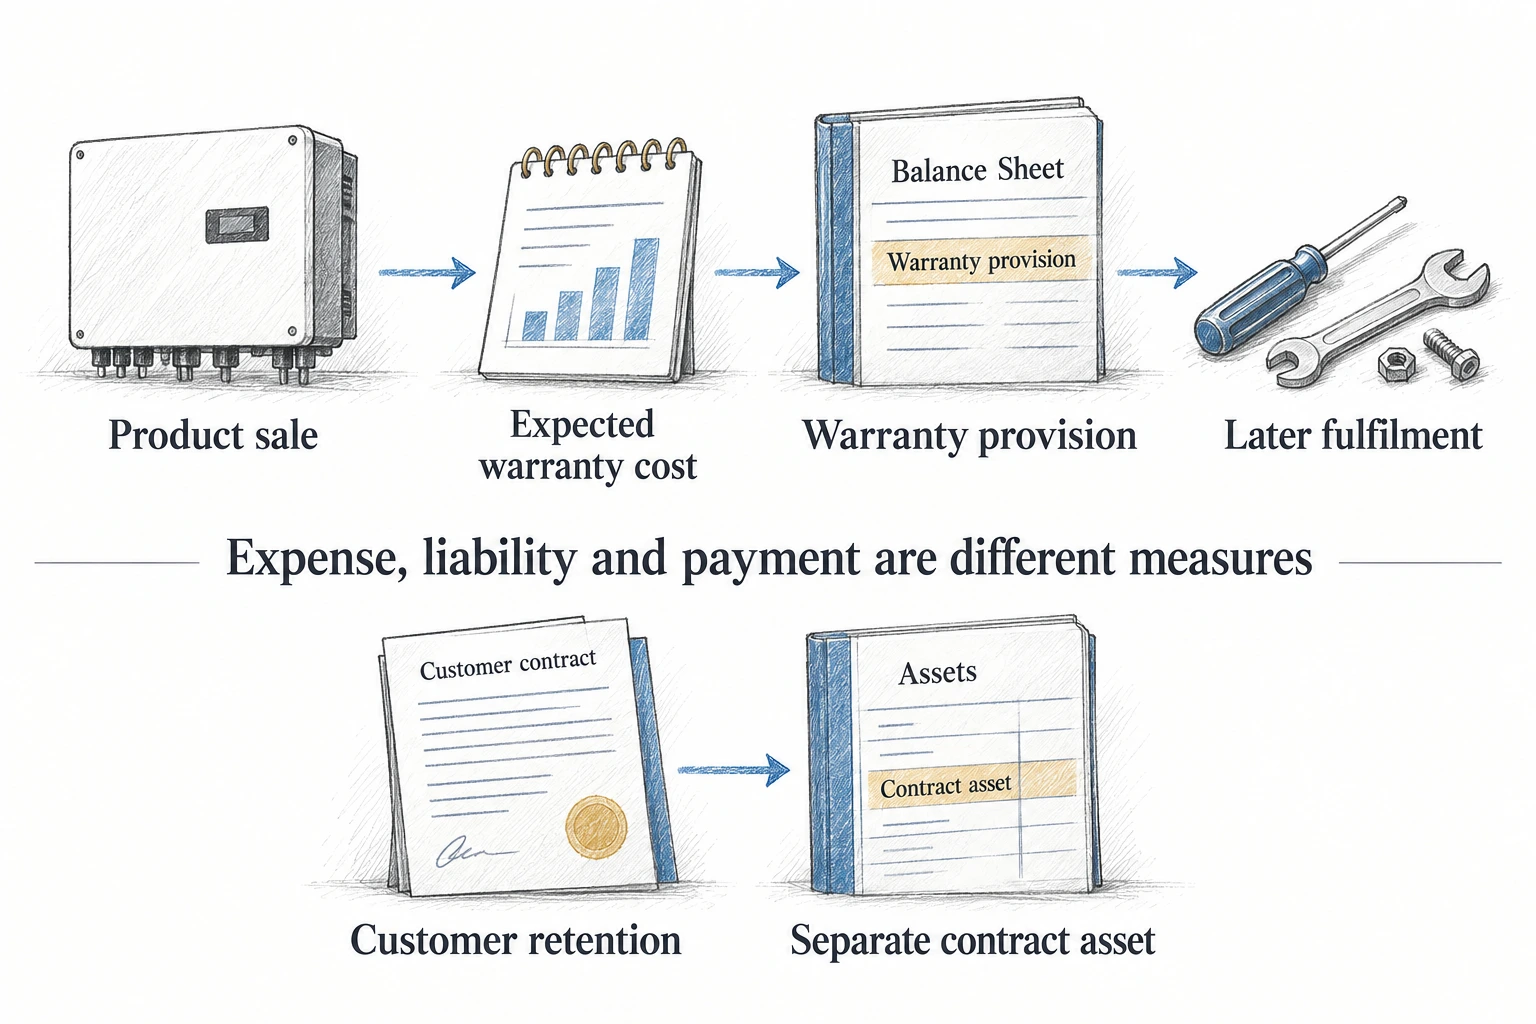
Background: the sale is not the end of the relationship
Sungrow’s businesses include photovoltaic inverters, energy-storage systems, and renewable-energy project activities. An inverter converts electricity into a form usable by the relevant electrical system; an energy-storage system supports storing and releasing energy. For a customer, buying this equipment can begin a long operating relationship rather than end at shipment. Performance and service after delivery can affect the value received from the original purchase. [S04, p.8; S05, p.3]
The company’s March 2026 investor record gives that idea commercial substance. It says customers care about stable product operation and after-sales experience, and describes local sales, technical, and service teams. This is an attributed explanation of the company’s strategy, not independent evidence that every product performs as expected. It nevertheless shows why a warranty can be an integral part of the offering rather than an incidental expense. [S05, p.3]
An ordinary investor may think of a warranty as a promise that a broken product will be repaired. In the financial statements, the promise raises a timing problem. Revenue from a qualifying sale can be recognized before every future repair or service cost has been incurred. If the remaining obligation can be estimated, recording a provision recognizes an expected cost and liability before cash is paid to perform the work.
That accounting purpose is different from recognizing a specific unpaid invoice from a service provider. A provision contains estimation because the exact eventual cost or timing is not fully settled at the reporting date. It is also different from a stockpile of cash. A company can record a warranty provision without opening a separate account containing the same amount. The accounting entry identifies an obligation; treasury decisions determine how later spending is funded.
The relevant economic population is products still under coverage. Suppose a company grows rapidly for several years. New sales add covered products before older products leave the warranty period. The remaining obligation can build even when each product’s expected service cost is stable. If sales later slow, the older covered products do not cease to exist. Their remaining service requirement can continue while the year’s revenue is lower.
That is why the timing of the provision deserves its own analysis. Current sales are visible in the income statement, but past sales can keep generating obligations. A reader needs to distinguish the growth of the covered population from a higher expected cost for each product. The same closing balance might reflect many more products at an unchanged cost assumption, fewer products at a higher assumption, or a mixture of changes.
The documentary trail
The 2022 report recorded approximately CNY1.002 billion under after-sales service costs within provisions, compared with CNY210.1 million at the beginning of that year. It explained the method using remaining warranty months and an average after-sales service cost rate, and attributed the increase in total provisions mainly to growth in inverter and storage revenue with corresponding service-cost recognition. This is an early disclosed explanation, not a later concern introduced by an auditor. [S04, p.158]
The 2024 report’s comparative provision note supplies CNY2.528 billion for assurance-type warranties at the end of 2023 and CNY4.235 billion at the end of 2024. Its narrative again links increased after-sales costs to the inverter and storage businesses. The early and later captions are not identical, so this review preserves that naming distinction rather than claiming every product category remained unchanged across the entire series. [S03, p.194]
The 2024 report also documents the expense reclassification. The company says it applied the changed accounting treatment for assurance-warranty expenses, moving those expenses into cost of sales and adjusting 2023 comparatives. This is a disclosed policy-related presentation change. It is not a basis for describing the company as having confessed to fabricated profit or as having newly incurred the comparative expense in 2024. [S03, pp.8,161]
The 2025 report retains the remaining-months description and records CNY5.569 billion for assurance-type warranties. The first-half 2026 report updates the balance to CNY5.683 billion and repeats that calculation description. The latest investor record discusses a lower revenue base, changed geographic and business composition, and the company’s liquidity position. It does not provide a quantified product-cohort bridge for the warranty estimate in the materials reviewed. [S01, p.193; S02, p.171; S06, pp.2,4-5]
Follow-up searches covered the company’s announcement and investor-relations index entries through September 20, 2026. The analysis is based on the identified annual reports, interim report, and investor records, rather than a full-text review of every indexed document. Further explanations may exist outside those materials.
How the mechanism works
Assurance and a separate service are different promises
Sungrow’s accounting policy distinguishes assurance-type warranties from service-type warranties. Assurance concerns whether the sold product meets specified standards and is accounted for under its provisions policy. A warranty providing an additional separate service is treated as a separate performance obligation, with part of the transaction price allocated to that service and revenue recognized as control of the service passes to the customer. [S01, p.154; S02, p.131]
In plain terms, one promise supports the quality standard of the original product; another can involve selling an additional service. The distinction affects both sides of the accounts. An expected cost of honoring an assurance promise can create an expense and provision. A separately sold service can require part of the sale price to be allocated to service revenue rather than recognized entirely as product revenue at once.
Consider a hypothetical sale with a standard assurance warranty and a separately purchased extended maintenance service. The manufacturer might estimate expected costs of the assurance obligation and separately account for the customer’s payment for maintenance. Combining the two as a single warranty balance would mix a cost estimate with consideration for a service. This example describes the accounting distinction, not Sungrow’s actual contracts, prices, or warranty durations.
The public policy does not tell readers how much of each type is included in every product offering. It should therefore not be used to assume that all deferred revenue is warranty income or that every long-duration warranty is a separate service. The policy itself says the evaluation considers matters such as legal requirements, duration, and the nature of promised tasks. A product-specific conclusion requires the contract and the company’s classification.
Remaining months create a stock of exposure
The method disclosed beneath the provision focuses on products still within warranty at period-end. Remaining months matter because a newly covered product and a product close to expiry can have different remaining service obligations. A total sales number does not describe that age structure. Products leaving coverage reduce the remaining population, while new covered products add to it. [S01, p.193]
For a simple illustration that does not estimate Sungrow’s liability, imagine 10,000 hypothetical units, each with 24 months of remaining coverage and expected monthly service cost of CNY10. Under a deliberately simplified linear model, the remaining estimate is CNY2.4 million. If the monthly cost assumption changes to CNY12 with all else unchanged, the estimate becomes CNY2.88 million, an increase of CNY480,000. None of these quantities or rates comes from Sungrow.
The example shows why disclosing a method without the inputs leaves important uncertainty. A 20% change in the assumed cost produces a 20% change in this simplified estimate. A change in the number of units or the months remaining also changes it. In a real product portfolio, different cohorts and service patterns can make the calculation more complex. The company’s published sentence does not specify that its rate is a simple CNY-per-unit-month assumption; that is only the teaching model used here.
The relevant cost can also vary with what the warranty requires. Parts, labor, logistics, and the nature of the promised remedy could affect the eventual economic burden. This review does not establish Sungrow’s contractual coverage for those components or assign them numerical costs. Their importance is to define a useful disclosure request: what cost base and experience support the average rate, and how do product and geographic differences enter it?
An average can be appropriate if it represents the underlying population well. It can be less informative to outsiders when materially different products, ages, or service environments are grouped together without an explanation. The word average is therefore neither evidence of poor accounting nor a complete answer to whether the estimate is sufficient. It identifies the point where a reader needs information about weighting and experience.
Expense, obligation, and cash occupy different periods
The warranty expense recognized for a period and the liability outstanding at the end of that period are different measures. New expected obligations can increase the liability. Fulfilling earlier obligations can reduce it. Revised estimates can increase or reduce it. Other movements may also be relevant. The net change combines these effects; it does not isolate the year’s original charge.
A hypothetical roll-forward makes the distinction explicit. Start with a provision of 100 units, add 45 for newly recognized expected costs, use 30 in honoring obligations, and release 5 after revising earlier estimates. The closing provision is 110. Its net increase is 10, not the 45 of new charges. Nor does the 10 measure the 30 of utilization. These numbers are invented and do not describe Sungrow’s movement schedule.
Even utilization is not automatically identical to immediate cash payment. Work may involve inventory consumed, an invoice recorded before payment, or other forms of settlement. A cash-flow statement then reports money when it is actually received or paid according to its classifications. An analyst needs a reconciliation before calling every provision reduction repair cash or every increase an expense included in that year’s gross margin.
The timing can affect comparisons between profit and operating cash flow. Recognizing estimated costs before payment can reduce profit earlier than it reduces cash. Cash paid to fulfill an older obligation can reduce current cash without being a newly recognized expense of the same amount. That is the ordinary reason to distinguish accrual accounting from cash movements; it is not evidence that the company is manufacturing cash conversion.
For an investor evaluating product economics, the question is whether each sales cohort carries an appropriate expected lifetime service cost. Looking only at cash paid today can understate a future requirement. Looking only at the net balance increase can understate a charge when utilization is substantial. Looking only at the closing stock can overstate the cost attributable to current sales. The relevant measure depends on the question being asked.
Customer retentions are not a warranty fund
Chinese filings can use similar warranty-related wording on both sides of the balance sheet. Sungrow reports unexpired warranty retentions within contract assets. Those are assets relating to amounts receivable from customers under the applicable conditions. The assurance-warranty provision is a liability representing expected obligations. Similar terminology does not make one a bank deposit held to settle the other. [S01, pp.171-172; S02, p.149]
Contract assets are also not necessarily unconditional receivables collectible immediately. The relevant conditions and classification matter. A customer retention might be released after a contractual milestone or period, but the reviewed aggregate table does not provide every contract’s release schedule. It would be inappropriate to assume all retentions fund all warranty work at matching dates.
The amounts belong to different risk models. An allowance on a retention asset concerns expected credit loss on a right to receive consideration. A warranty provision concerns expected cost of performing an obligation. A higher credit allowance does not establish that the underlying products have more defects. A higher warranty estimate does not automatically establish that customers will refuse to pay retentions.
There may be commercial connections in particular contracts, but aggregate financial-statement balances do not prove those matches. The customers, entities, products, currencies, and settlement rights could differ. Without those details, netting the asset against the liability would conceal both collection exposure and service exposure. The correct reading keeps each gross balance and its relevant adjustment visible.
What the numbers show
A growing remaining-obligation balance
The following table follows the relevant provision component, not every item within total provisions. Amounts are CNY million, rounded. The early note calls the item after-sales service costs; the later notes call it assurance-type warranties. The figures are reported estimates, not counts of customer complaints or repairs.
| Reporting date | Warranty-related balance | Change from previous listed date |
|---|---|---|
| December 2021, comparative in the 2022 note | 210.102 | Not calculated |
| December 2022 | 1,001.992 | +791.891 |
| December 2023 | 2,528.439 | +1,526.447 |
| December 2024 | 4,234.974 | +1,706.535 |
| December 2025 | 5,568.918 | +1,333.944 |
| June 2026 | 5,683.132 | +114.214 |
Sources: S04 p.158; S03 p.194; S01 p.193; S02 p.171. The June change covers six months rather than a full year.
The assurance-warranty balance grew approximately 67.49% during 2024, 31.50% during 2025, and 2.05% in the first half of 2026. The 2024 report separately describes growth of 70.64% in total provisions, which also includes other components. That percentage should not be copied as the growth rate of the warranty component alone. [S03, p.194; calculations from the component balances]
The slowing increase is useful context. A story presenting the balance as accelerating indefinitely would not fit the latest movement. At the same time, the CNY114.2 million half-year net increase does not reveal the amount charged or used during that half-year. A small net change can coexist with larger additions and larger utilization. Without the bridge, its apparent moderation cannot determine whether estimates became more conservative or more optimistic.
The December 2025 balance equals approximately 6.24% of that year’s revenue. This is a stock-to-flow scale comparison, calculated as CNY5,568,917,783.49 divided by CNY89,184,357,325.77. It is not a warranty expense rate on 2025 sales, a defect rate, or a percentage of cash already paid. The denominator contains one year’s revenue, while the numerator includes remaining obligations associated with products from different sales periods. [S01, pp.9,193]
That distinction is essential to avoid a false trend. If revenue fell while the remaining stock stayed unchanged, the ratio would rise mechanically. It would not follow that the service assumption per product had increased. Conversely, strong current sales could lower a stock-to-revenue ratio while adding long-duration obligations. A ratio can flag the scale of the estimate without identifying its adequacy.
The caption includes other obligations
The 2025 provisions note lists CNY5.569 billion of assurance warranties, CNY97.9 million of expected sales returns, CNY2.0 million of onerous contracts, and CNY32.0 million of other items. Total provisions were CNY5.701 billion. Warranty was the dominant component, but the total and the warranty balance are not identical. [S01, p.193]
In June 2026, total provisions were CNY5.883 billion, including CNY5.683 billion of assurance warranties, CNY82.0 million of expected returns, and CNY117.9 million in other items. The opening other-items comparative combines the earlier onerous-contract and other balances. That change in table grouping should not be mistaken for an entirely new expense of the same amount. [S02, p.171]
This also separates a warranty remedy from an expected sales return. Repairing a product under an assurance promise and estimating consideration expected to be refunded for returns can involve different obligations and accounting. Combining their balances into one repair-cost estimate would lose that distinction. The article focuses on the assurance component because that is where the remaining-months method is disclosed.
An actual example of expense and balance movement differing
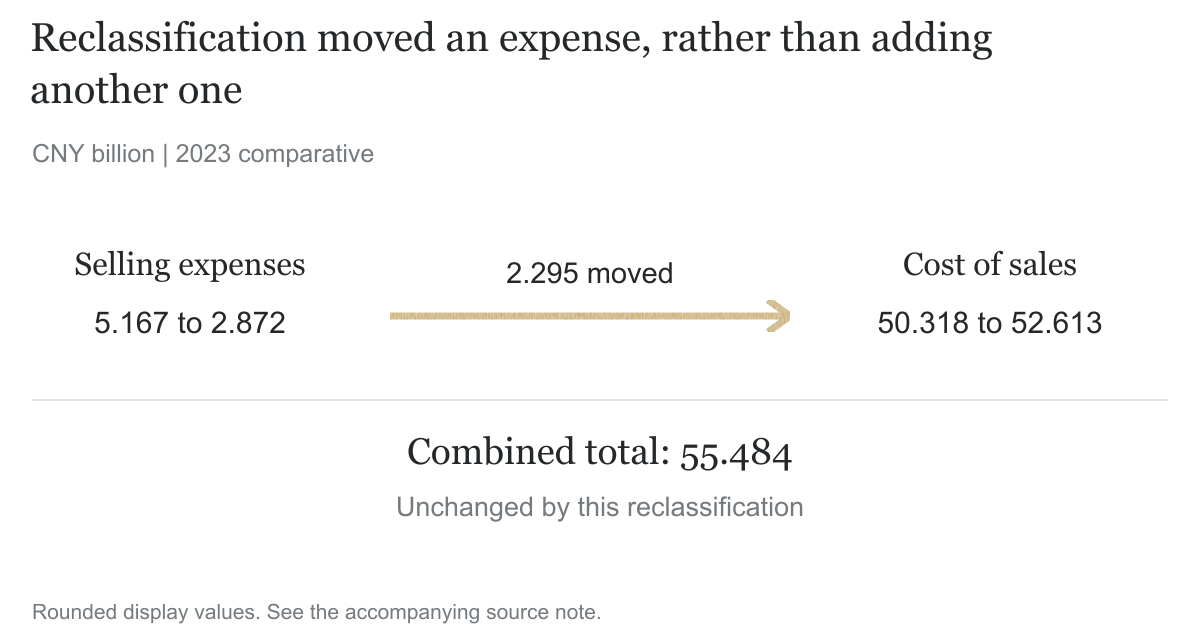
The 2024 policy note supplies an unusually useful bridge for reading the older figures. For the 2023 consolidated comparatives, cost of sales moved from CNY50.318 billion to CNY52.613 billion, while selling expenses moved from CNY5.167 billion to CNY2.872 billion. The exact amount transferred was CNY2,295,121,641.62. The transfer does not add a second expense; the amount removed from one line equals the amount added to the other. [S03, p.161]
| 2023 consolidated line, CNY billion | Before reclassification | After reclassification | Movement |
|---|---|---|---|
| Cost of sales | 50.318 | 52.613 | +2.295 |
| Selling expenses | 5.167 | 2.872 | -2.295 |
| Sum of these two lines | 55.484 | 55.484 | 0 |
Components and totals are rounded independently.
The same year’s warranty-related balance increased from CNY1,001,992,441.90 to CNY2,528,439,020.77, a net increase of CNY1,526,446,578.87. The reclassified expense amount exceeds that net increase by CNY768,675,062.75. Those figures demonstrate a difference between a period expense presentation and the net movement of an outstanding estimate. [S04, p.158; S03, pp.161,194; arithmetic]
The CNY768.7 million difference is not a reconstructed cash-utilization number. The reviewed notes do not provide a complete bridge assigning it among utilization, releases, other movements, or possible differences in the amounts being reconciled. To label the full difference cash repairs would impose an unsupported explanation on an observed arithmetic gap.
This is nevertheless valuable evidence. It prevents the common shortcut of treating the increase in provisions as the entire cost of warranty obligations for the year. It also shows why the desired follow-up should be a roll-forward, not simply a repetition of the closing balance. A new-charge line and an actual-use line would make the timing question testable.
Reclassification changes the margin comparison
Gross profit is revenue less cost of sales. Moving an existing expense into cost of sales reduces gross profit relative to the old presentation, even if it leaves the sum of operating expenses unchanged. For Sungrow’s 2023 comparative revenue of CNY72.251 billion, the CNY2.295 billion transfer changes the gross-margin presentation by approximately 3.18 percentage points. The calculation divides the transfer by unchanged comparative revenue and multiplies by 100. [S03, pp.8,161]
That is large enough to distort a trend if an analyst compares an old unadjusted margin with a later adjusted one. A decline caused by moving warranty expense above the gross-profit line is not the same as an economic deterioration in product profitability. A reported later improvement also needs to be measured against the adjusted comparative, not whichever historical number makes the improvement appear larger.
The policy note reports zero cumulative effect on retained earnings at the beginning of the earliest comparative period for this treatment. Moving the expense between cost of sales and selling expenses changes its presentation, without creating an additional cost or cash payment. That observation applies to this reclassification, not to every accounting-policy change in the report. [S03, p.161]
There is a different, genuinely economic question about the assumed future service cost. If expected remaining costs were revised upward, an additional charge could affect profit. If a supported estimate fell, the accounting consequences could move the other way. The reclassification and a change in estimation inputs should not be merged into one narrative. One relocates an expense; the other can change the measured expense or liability.
Customer retentions: gross value, allowance, and net value
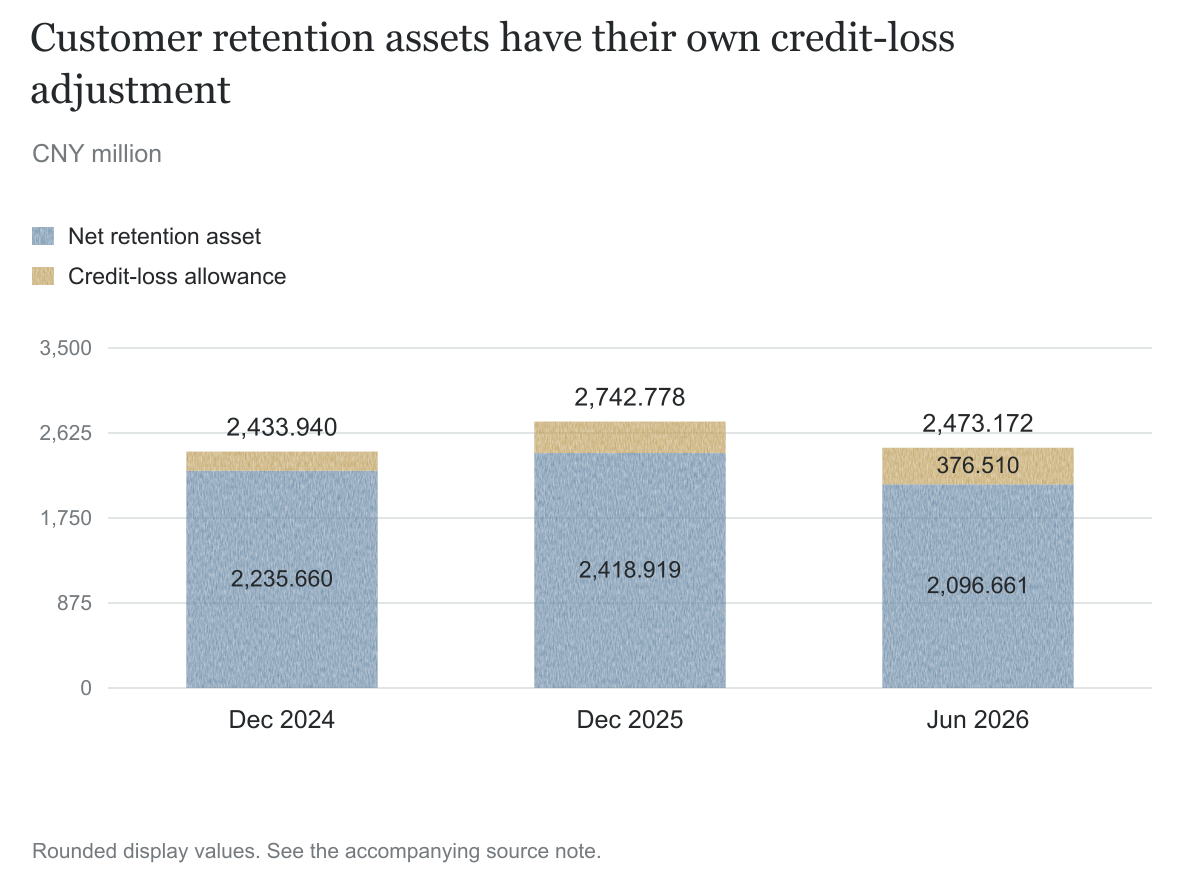
The contract-asset note allows a separate three-date comparison. This table uses the total unexpired warranty-retention category, including its applicable allowances, rather than only one collective-assessment subcategory. Amounts are CNY million. [S01, pp.171-172; S02, p.149]
| Date | Gross retention asset | Loss allowance | Net retention asset |
|---|---|---|---|
| December 2024 | 2,433.940 | 198.280 | 2,235.660 |
| December 2025 | 2,742.778 | 323.858 | 2,418.919 |
| June 2026 | 2,473.172 | 376.510 | 2,096.661 |
For this total category, the allowance divided by gross value rises from approximately 8.15% to 11.81% to 15.22%. The collective-assessment table can display a slightly different rate because its gross amount and allowance exclude separately assessed items. Keeping the denominator consistent is more useful than copying a rate from a nearby table with a different scope.
An increasing allowance ratio warrants a collection-quality question, but it does not supply a cause. It can reflect changes in the age or composition of the retained balances, credit-loss estimates, or specific items. The aggregate numbers do not show that customers are withholding payment because of defective products. Linking credit deterioration to warranty performance would require contract- and customer-specific evidence.
The first-half 2026 net reduction also needs to be unpacked. The net retention asset fell by CNY322.3 million. Of that arithmetic change, CNY269.6 million comes from the lower gross balance and CNY52.7 million from the higher allowance. The higher allowance is not a cash receipt. The gross reduction cannot all be labelled collections without a movement schedule: recognition, release, transfer, and other movements can affect a contract-asset balance.
These figures complicate two simplistic stories. The retention asset did not continue rising through June 2026, so an uninterrupted accumulation narrative would be inaccurate. But the fall in net value does not prove that all retained consideration was released and collected. Both observations belong in a careful reading because the net figure combines two different movements.
Current and non-current classification is another dimension
At December 2025, total net contract assets in the note were CNY3.300 billion. Of that total, CNY1.642 billion was presented in other non-current assets, leaving CNY1.659 billion in the current contract-asset line. In June 2026, the corresponding figures were CNY2.937 billion, CNY1.451 billion, and CNY1.486 billion. [S01, pp.171-172; S02, p.149]
These totals include both unexpired retentions and completed but unbilled assets. The category split and the current-versus-non-current presentation answer different questions. The warranty-retention category should not be added to the current balance as if it were an extra asset outside the total. Nor does the balance-sheet current line represent the entire amount of customer retentions.
The distinction matters when discussing funding. Treating the whole note as money collectible within one year would ignore the non-current presentation and the contractual conditions. Subtracting all contract assets from the warranty provision would additionally mix different categories of asset and liability. A useful investor schedule would show expected release and collection of retained amounts separately from expected fulfillment costs.
Growth, profit, and cash provide the counterweight
The five-year financial context prevents the liability discussion from becoming a generic distress story. The following table shows reported consolidated revenue, profit attributable to listed-company shareholders, and consolidated operating cash flow. Amounts are CNY billion, rounded. The 2022 attributable-profit figure uses the adjusted comparative in the 2024 report; 2021 uses its historical presentation. This is not a constant-consolidation-scope series. [S04, p.10; S03, p.8; S01, p.9]
| Year | Revenue | Attributable profit | Consolidated operating cash flow |
|---|---|---|---|
| 2021 | 24.137 | 1.583 | -1.639 |
| 2022 | 40.257 | 3.593 | 1.210 |
| 2023 | 72.251 | 9.440 | 6.982 |
| 2024 | 77.857 | 11.036 | 12.068 |
| 2025 | 89.184 | 13.461 | 16.918 |
The series shows major growth and a substantial improvement in operating cash flow from its negative 2021 level. In 2024 and 2025, consolidated operating cash exceeded the attributable-profit figure. Because one measure covers consolidated cash and the other reflects shareholder attribution, the comparison is not an exact cash-conversion rate. It is sufficient to show that a warranty discussion should not ignore the company’s strong recent cash generation.
The latest half-year picture is more mixed. Revenue was CNY30.912 billion, attributable profit CNY5.259 billion, and operating cash flow CNY3.735 billion. Revenue and profit fell from the prior first half, while operating cash flow increased 8.75%. Profit excluding non-recurring items fell more sharply, by 42.96%. Those are six-month comparisons, not forecasts of the full year. [S02, p.9]
At June 2026, the cash-flow note reports CNY30.861 billion of cash and cash equivalents. The company also describes its working capital and liquidity as sound in the latest investor record. The reported cash is a meaningful resource; the company’s description is an attributed assessment. Neither is evidence that cash equal to the warranty provision has been legally segregated for that purpose. [S02, p.179; S06, p.5]
Financial capacity and estimate adequacy are distinct. A well-funded company can have an inaccurate estimate and still pay the resulting costs. A provision can be adequate even when cash is needed for many competing uses. The central question here is whether readers can understand the cost assumption and its subsequent performance, not whether one comparison predicts insolvency.
Company explanations and competing interpretations
The company’s historical explanation is commercially plausible: growth in inverter and storage businesses creates more products with remaining warranty obligations. Its remaining-months method is consistent with an obligation that continues after the original sale. A larger balance can therefore reflect successful expansion rather than a higher failure rate. The public record supports that as a genuine competing interpretation. [S04, p.158; S03, p.194]
The latest half-year investor record explains weaker revenue principally through domestic and Middle Eastern changes. It attributes margin improvement partly to the lower share of a lower-margin project-development business and a higher European contribution, while noting other pressures on storage margins. These are explicit company explanations of the operating changes. They should not be replaced with a claim that warranty assumptions alone caused the reported margin movement. [S06, pp.2,4-5]
A more cautious interpretation focuses on model risk. If the expected service cost or remaining duration is not representative of the actual covered products, the provision could require adjustment later. That is a conditional mechanism, not an established shortfall. The direction cannot be inferred from the balance’s growth alone: a higher provision could reflect more conservative estimation as well as more exposure.
The separate collection interpretation concerns customer retentions. A rising loss allowance raises a question about the asset’s recoverability, but the latest lower gross balance is counterevidence to uninterrupted accumulation. Without a contract-level connection, neither trend demonstrates a product-quality problem. The asset analysis adds a second cash pathway to understand, rather than corroborating an unsupported defect allegation.
The disclosure-quality interpretation is the most firmly supported. Investors have the closing values, a calculation description, and relevant financial context, but lack enough detail to reproduce how the remaining service obligation changed. A roll-forward and an explanation of assumptions would help distinguish population growth, estimation changes, and actual fulfillment. That request remains useful whether the eventual answer confirms prudent provisioning or reveals a need for revision.
What remains unresolved
The reviewed disclosures do not provide a sufficiently detailed product-cohort schedule of remaining warranty months. They also do not supply the average rate’s numerical inputs and weighting in a form that reconstructs the closing amount. It is therefore not possible to isolate the effect of changing product mix, duration, expected service cost, or geographic composition from the aggregate provision.
Actual experience is another missing link. A meaningful comparison would connect previous estimates with utilization and revisions as products age. That would show whether a cohort’s expected costs tend to be sufficient, too high, or too low. A current-year charge alone would not answer the question, because earlier products continue to generate obligations and their estimates can change.
The CNY768.7 million difference between the 2023 reclassified expense and provision net increase is a concrete place to begin. A company reconciliation could identify the relevant expense population, actual utilization, releases, and other movements. Until such a bridge is available, the difference should remain unassigned rather than be described as repair cash, hidden expense, or an accounting error.
The retention assets need their own release and collection schedule. A lower gross balance may be positive, but a growing allowance means net movements cannot all be treated as cash recovery. Matching expected collections with fulfillment spending would require actual contracts and entities, not a subtraction of two totals carrying related labels.
Evidence could change the concern. Stable cohort-level actual costs supported by a transparent bridge would strengthen confidence in the estimate. Persistent upward revisions associated with identifiable older product groups would make the estimation question more pressing. A clear explanation of why product and region differences are adequately captured in the average rate would narrow the current disclosure gap.
Questions investors should ask
What is the warranty provision’s full movement schedule for each reporting period? New recognition, use, reversal, and other changes should be distinguishable. That is the most direct way to avoid treating net growth as an expense or treating a decline as cash paid.
How are covered products grouped for the estimate, and what is the distribution of remaining months? Which product and geographic differences matter to the average service cost rate? A useful answer would clarify the cost base and weighting without requiring disclosure of every individual customer contract.
How does actual service experience compare with the estimates made when the relevant products were sold? Are changes in the closing provision mainly caused by more covered products, longer remaining obligations, or revised expected costs? A cohort-based explanation would separate a successful sales history from estimation sensitivity.
Which margin comparisons use the adjusted assurance-warranty classification? The 2023 reclassification moved CNY2.295 billion across the gross-profit boundary. A consistent comparative basis is necessary before attributing changes to price, product economics, or service cost.
How are customer retentions released, collected, and assessed for credit loss? How much is current versus non-current, and which conditions remain outstanding? These questions concern an asset’s cash conversion; they should be answered separately from whether the warranty provision adequately measures future service obligations.
Conclusion
Sungrow’s provision covers future service on products already sold. The central question is whether the cost assumptions remain reliable as those products age. Closing balances, annual expense, actual service spending, and customer retentions each provide a different part of that assessment; the reviewed filings do not establish that the provision is inadequate.
The 2023 expense reclassification and the differing provision movement offer a concrete lesson. Moving a warranty expense into cost of sales changes the gross-margin presentation, while the liability’s net increase does not reveal that expense or the cash spent. The first-half 2026 figures add another: lower revenue need not immediately reduce obligations on products already under warranty.
The most useful investor question is how the estimate performs as those products age. A quantified assumption and movement bridge would make that question answerable. Until then, the issue is one of understanding remaining service exposure and its effect on product economics, with strong reported cash resources and the company’s growth explanations fully included in the analysis.
Sources
Locations are physical PDF pages. The research distinguishes closing provisions, reclassified expenses, credit-loss allowances, and cash movements; amounts are CNY.
| ID | Primary document | Date | Relevant location |
|---|---|---|---|
| S01 | Sungrow 2025 Annual Report | 1 April 2026 | pp.9,154,171-172,193: financial results, warranty policies, retention assets, provisions and calculation description |
| S02 | Sungrow 2026 Interim Report | 29 August 2026 | pp.9,131,149,171,179: latest results, warranty types, retention assets, provision and cash composition |
| S03 | Sungrow 2024 Annual Report | 26 April 2025 | pp.8,161,194: adjusted comparisons, expense reclassification, historical warranty balance and company explanation |
| S04 | Sungrow 2022 Annual Report | 25 April 2023 | pp.8,10,158: business terminology, early financial context and after-sales provision method |
| S05 | Investor Relations Record, 31 March 2026 | Activity 31 March; published 1 April 2026 | pp.2-3: company’s growth, reliability and localized service explanations |
| S06 | Investor Relations Record, 28 August 2026 | Activity 28 August; published 29 August 2026 | pp.2,4-5: regional revenue changes, margin explanations and liquidity assessment |
Disclaimer
This report is based on the cited public information available by the stated cutoff and is prepared for educational and investor-protection purposes. It is not investment, legal, or accounting advice, or a recommendation to buy, sell, or hold any security. Hypothetical examples do not estimate Sungrow’s warranty rates, contract durations, product performance, or future payments. Detailed inputs by product group and a complete reconciliation of the warranty provision have not been obtained. No misconduct is alleged unless a competent authority has made such a finding. Readers should conduct their own due diligence.