Visionox's R&D Expense Fell. Its Development Asset Grew.
The 2025 research-and-development tables separate lower total investment from a larger amount carried forward as an asset. Following that amount into 2026 reveals the questions behind an apparently simpler expense decline.
- Company
- Visionox
- Ticker
- 002387.SZ
- Published
- October 3, 2026
- Information cutoff
- October 2, 2026
The detail
The 2025 annual report, pp.195–196, shows CNY218.8 million of new capitalized R&D and CNY157.3 million transferred to intangible assets, not current profit or loss. Development expenditure reached CNY259.5 million in the 2026 interim report, p.153.
Why this matters
Visionox's 2025 R&D expense decline combines lower total investment with higher capitalization. Project movement tables track the cost into intangible assets and an expanding development balance, while the 2026 figures and a new consolidation boundary qualify the interpretation.
The detail
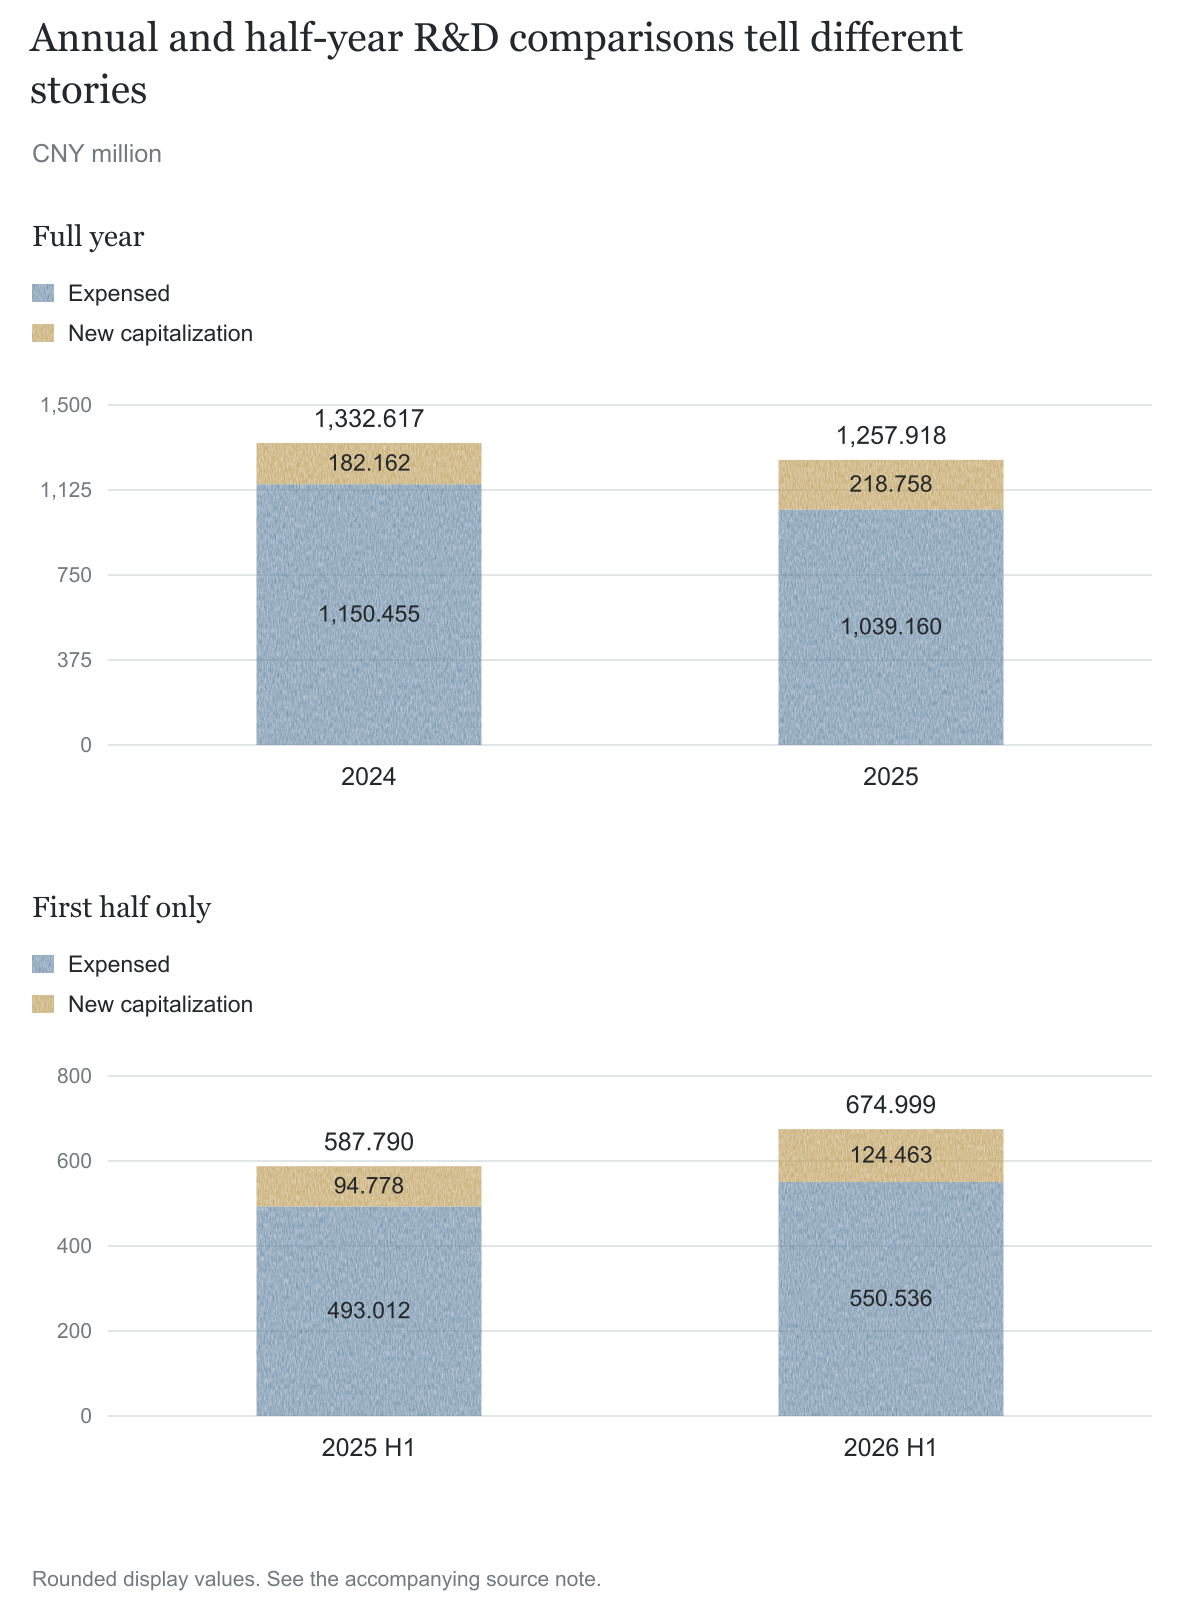
On page 22 of Visionox’s 2025 annual report, two adjacent rows move in opposite directions. Total research and development investment fell from CNY1,332.6 million to CNY1,257.9 million. The amount capitalized increased from CNY182.2 million to CNY218.8 million. The capitalization share rose from 13.67% to 17.39%. A reader who notices only lower R&D expense could miss that second movement. [S01, pp.22, 195]
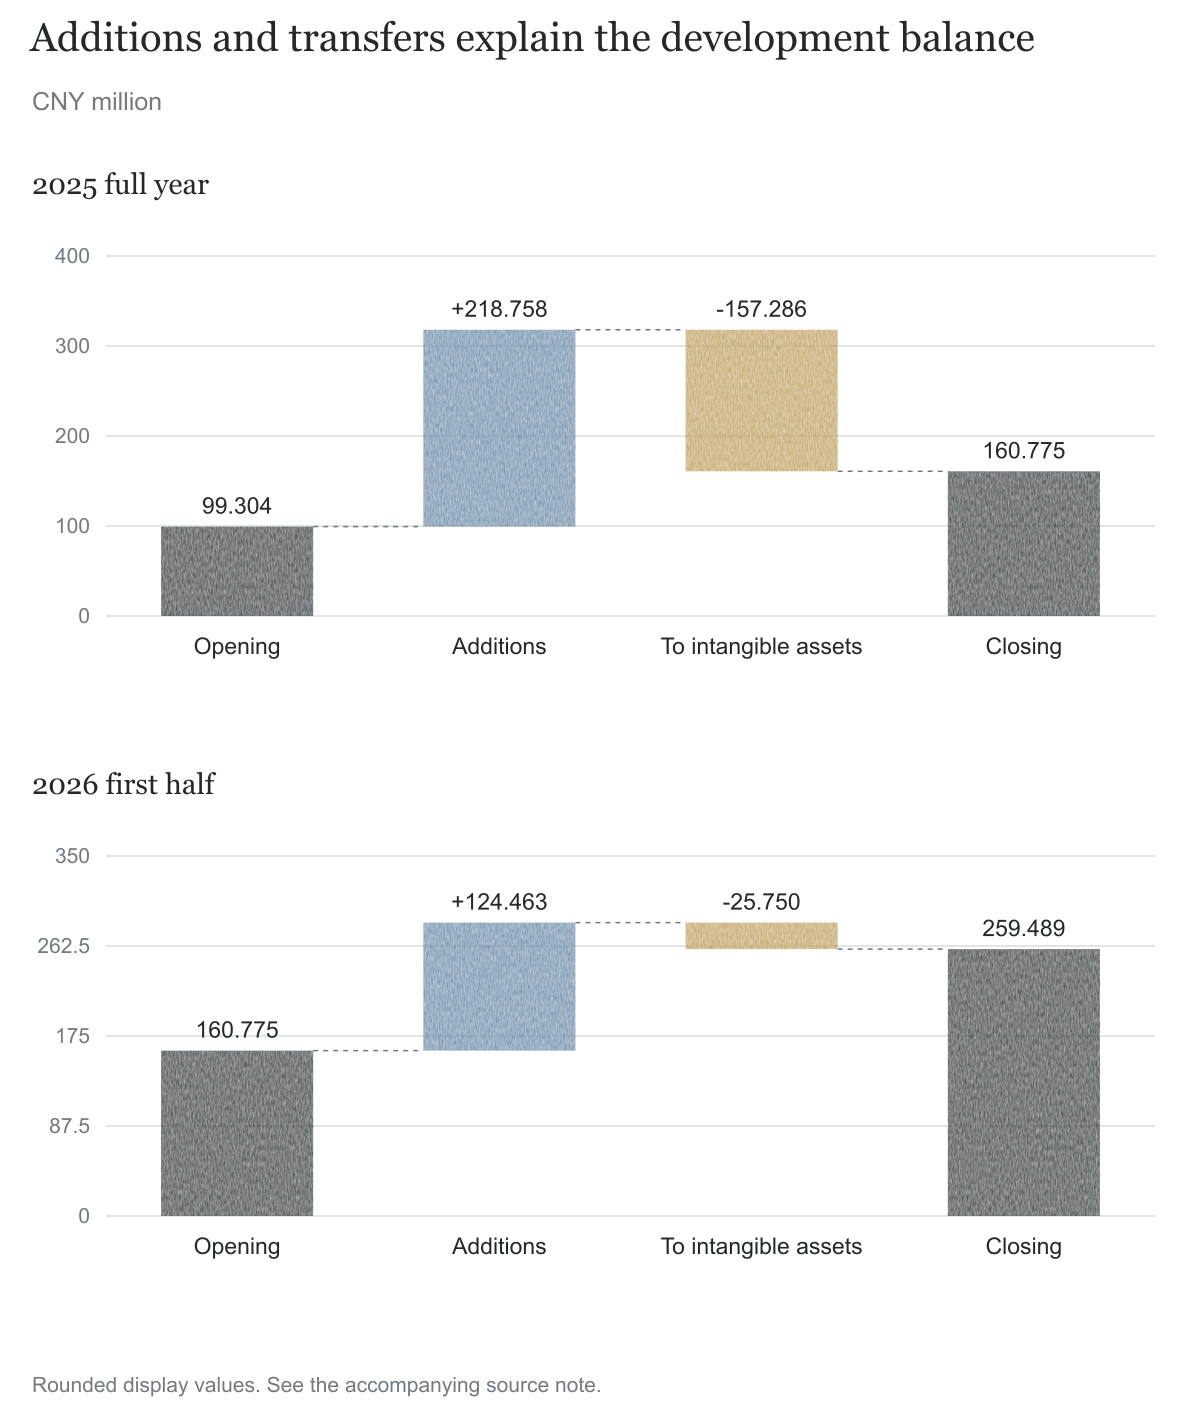
The project note nearly 180 pages later shows where the capitalized amount went. Visionox began 2025 with CNY99.3 million of development expenditure on its balance sheet, added CNY218.8 million, and transferred CNY157.3 million into intangible assets. It ended the year with CNY160.8 million still classified as development expenditure. By June 30, 2026, that balance had increased to CNY259.5 million. [S01, pp.195–196; S03, p.153]
The transfer is important. CNY157.3 million did not appear in the column for amounts transferred into current-period profit or loss. It appeared in the column for recognition as intangible assets. Moving an amount out of development expenditure therefore did not mean eliminating the asset or taking an immediate loss. It moved the amount to a different stage of the asset’s accounting life.
The question for investors is not whether a technology manufacturer should spend on development. Visionox’s business plainly depends on it. The question is what the expense decline tells us about current operating costs, and what evidence supports carrying some of those costs forward for future periods. Connecting the R&D summary, the project movement table, and the company’s own accounting policy provides a more informative answer than reading any one of them alone.
Executive summary
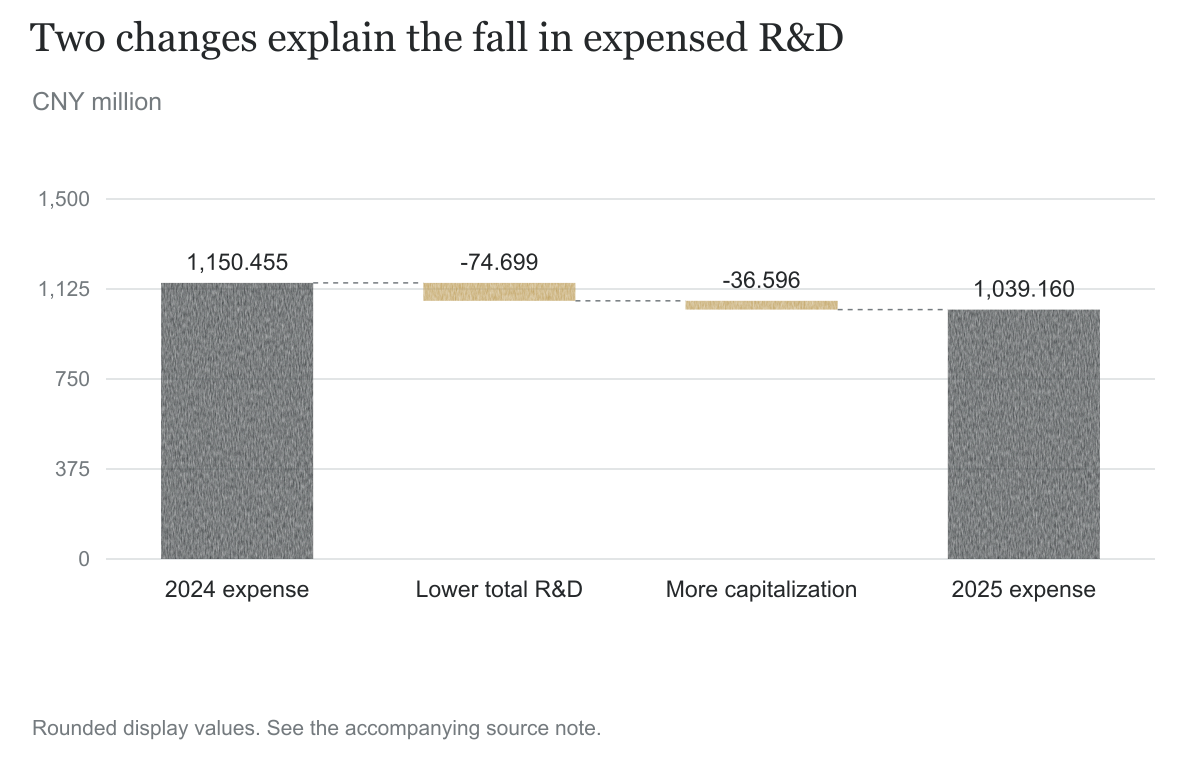
Visionox’s 2025 R&D expense decreased by CNY111.3 million. That decline has two arithmetic components: total R&D investment decreased by CNY74.7 million, while new capitalized R&D increased by CNY36.6 million. The second component represents about 32.88% of the expense decline. This is a decomposition of the disclosed tables, not proof that the company made an inappropriate accounting decision. [S01, p.195; calculations]
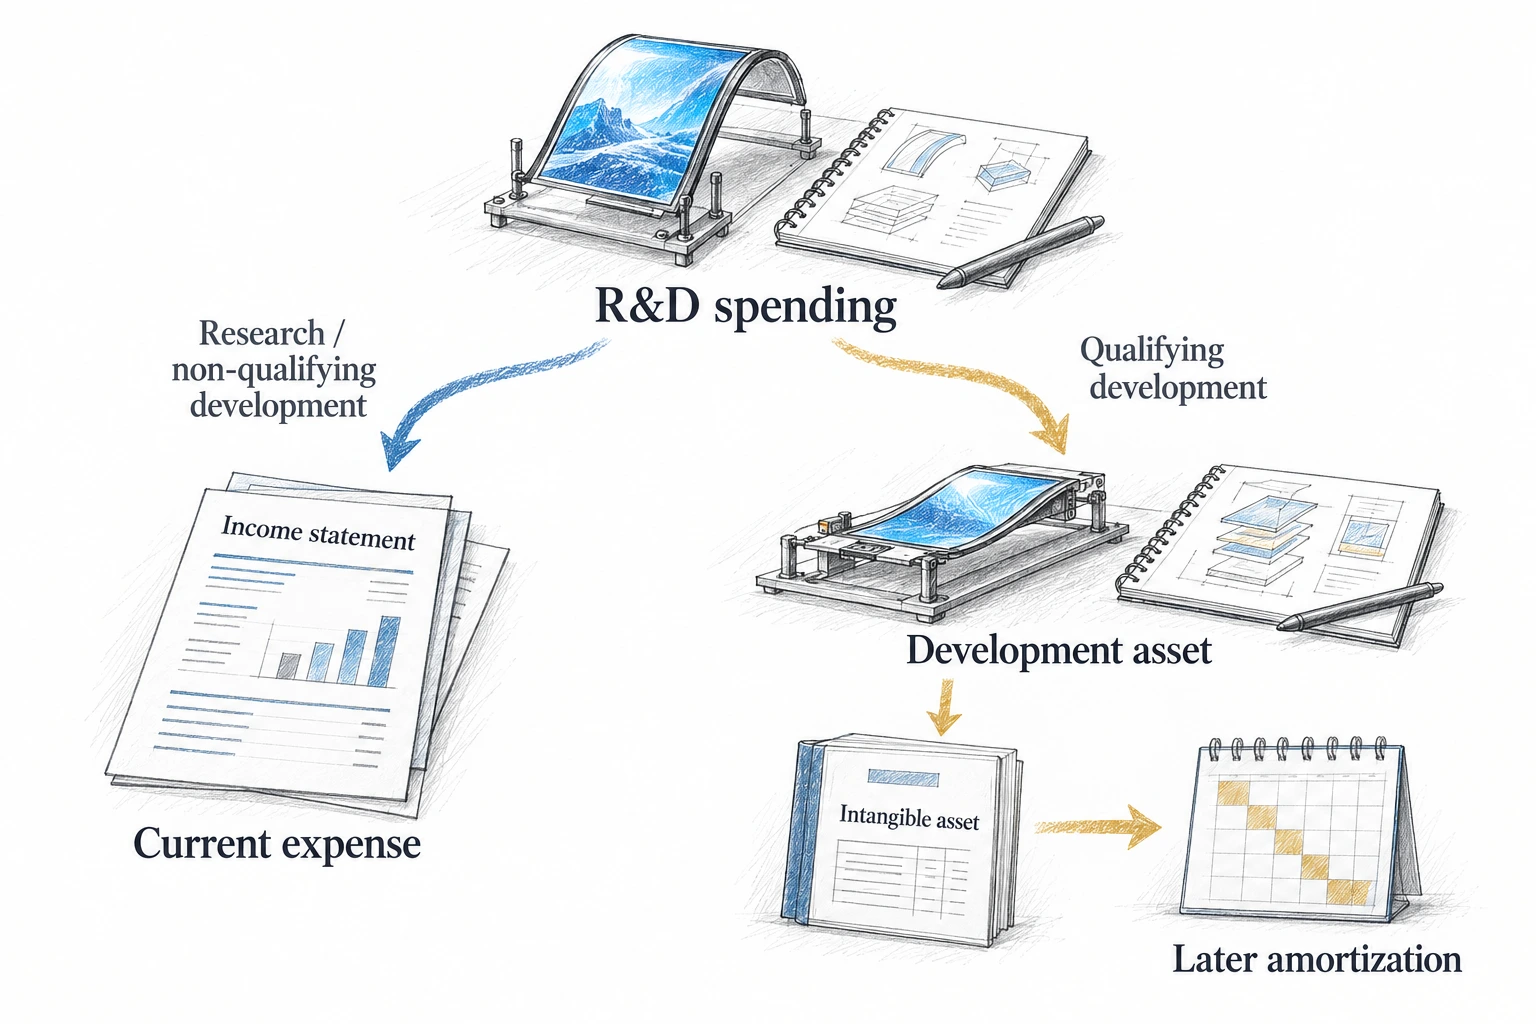
Capitalization means a cost is recognized as an asset rather than charged immediately as the current period’s R&D expense. It requires evidence of future usefulness and other conditions. Visionox’s policy states five conditions, including technical feasibility, intention to complete and use or sell the asset, an identifiable route to economic benefit, adequate resources, and reliable measurement. The policy also states that research-stage costs are expensed and that already-expensed costs are not retrospectively restored to the asset. [S01, p.142]
The outstanding development balance grew by approximately 61.90% during 2025 and another 61.40% during the first half of 2026. These are different-length periods and should not be combined into an annual growth forecast. The balance remains much smaller than the group’s total assets: CNY160.8 million was approximately 0.34% of total assets at the end of 2025. The argument concerns the visibility of a specific accounting mechanism, not a claim that development expenditure explains the group’s entire financial position. [S01, pp.11, 195–196; S03, p.153; calculations]
There are substantial competing explanations. More projects may have reached a qualifying development stage. Spending on some research activities may have fallen. The group added Hefei Visionox Electronics to its consolidated accounts in December 2025, changing the boundary of subsequent comparisons. In the first half of 2026, total R&D and expensed R&D both increased year on year, so the 2025 expense-decline narrative cannot simply be extended into the next period. [S01, pp.195–196; S02, p.127; S03, pp.13, 153]
The reviewed project tables provide balances and broad project categories. They do not provide a complete project-by-project bridge from the date capitalization began to technical completion, expected product revenue, and subsequent amortization. That bridge would help ordinary investors understand whether a higher capitalization share reflects genuine project maturation, a different mix of activity, or assumptions that deserve closer examination. None of those possibilities is resolved by the capitalization percentage alone.
What Visionox makes, and why development matters
Visionox Technology Co., Ltd., listed in Shenzhen under 002387, describes its business as the research, production, and sale of OLED display devices. Its disclosed application areas include smartphones, wearables, tablets, notebook computers, and automotive displays. OLED is a display technology in which an organic material layer emits light when current passes through it. The company’s annual report places technological improvement at the center of its business strategy. [S01, p.14]
For a reader approaching the accounts from scratch, a display manufacturer has two broad types of investment to understand. One is physical capacity: buildings, manufacturing equipment, and production lines. The other is knowledge and design: developing a product or process that can be used repeatedly. Both may generate benefits over more than one reporting period, but they do not reach an asset-recognition decision through exactly the same evidence.
A machine has a purchase price and an identifiable physical use. A development project may begin as an uncertain exploration. Its early work may produce nothing commercially usable, or it may establish a feasible design that can be developed into a saleable product. Deciding when the work has crossed that boundary is part of the accounting judgment. An investor cannot identify the boundary merely by observing that engineers were paid or that management calls the work innovative.
Visionox describes a progression from basic research to pilot testing and mass production. It also describes work on flexible displays, lower power consumption, thin modules, and other technical developments. Those statements explain why a portfolio can contain activities at different stages at the same time. They do not establish that every cost in the portfolio qualifies for capitalization. The project stage and the supporting evidence still matter. [S01, pp.14–15]
The annual report also describes display manufacturing as capital-intensive and technology-intensive, with substantial early physical investment and long construction cycles. It says production lines can face early operating challenges because unit costs are high and scale benefits have not yet been fully realized. That is a relevant company explanation for why short-term losses and long-term development efforts can coexist. It is not an assurance that all projects will achieve their intended returns. [S01, p.14]
This review therefore begins with the accounting route, not with a judgment about the commercial merits of a particular display technology. A project can be technically successful but produce disappointing margins. A company can report an overall loss while a particular project remains useful. The documents must be read at both levels without treating one as automatic proof of the other.
Three measures that should not be confused
The first measure is total R&D investment in the company’s table. For 2025, it was CNY1,257.9 million. The table divides that amount between expensed R&D and capitalized R&D. The two parts sum to the total. This is a measure of costs assigned to R&D activity in the reporting period, not simply the amount of cash handed to researchers and suppliers during that year. [S01, p.195]
The second measure is expensed R&D. Visionox reported CNY1,039.2 million for 2025. These are costs assigned to the current period’s expense route. The word expense says something about recognition in the accounts, not necessarily about the date cash left the bank. An unpaid service invoice can become an expense before payment, while depreciation can become an expense without a new cash payment in that period.
The third measure is new capitalized R&D. Visionox reported CNY218.8 million for 2025. This is the addition to the asset route from the year’s qualifying activity. It is not the same as the closing development-expenditure balance. The closing balance depends on opening assets, new additions, transfers, and any other disclosed reductions. Comparing the annual capitalized flow with the closing development stock as if they were interchangeable would obscure what happened.
The cost composition makes the cash distinction concrete. The 2025 R&D table includes CNY283.8 million of depreciation and CNY140.6 million of intangible-asset amortization. Those items describe the allocation of existing assets’ costs. They are not new purchases of the underlying assets in 2025. The table also includes labor, materials and molds, technical services, and other categories. A complete cash-spending analysis would need payment and classification information beyond the total R&D figure. [S01, p.195]
Amortization in that table is not necessarily the amortization of only the internally developed assets examined here. The table gives a cost category, not a full identification of every underlying intangible asset. An investor should not subtract that entire CNY140.6 million from the year’s CNY218.8 million capitalization and call the result the net earnings effect of internal development. The two figures have different populations and different timing.
These distinctions may sound technical, but they protect the central observation from becoming a misleading claim. Visionox’s total R&D investment fell in 2025, more of that investment followed the capitalization route, and expensed R&D fell further than the total. Those facts are established. A claim that all R&D cash spending fell by the same amount, or that reported net profit improved by the capitalization amount, would go beyond them.
The expense decline, reconstructed
The relevant annual figures can be placed in one short table. Amounts below are rounded to CNY million; calculations use the unrounded numbers in the source.
| R&D measure | 2024 | 2025 | Change |
|---|---|---|---|
| Total R&D investment | 1,332.617 | 1,257.918 | −74.699 |
| Expensed R&D | 1,150.455 | 1,039.160 | −111.295 |
| New capitalized R&D | 182.162 | 218.758 | +36.596 |
| Capitalized share of total | 13.67% | 17.39% | +3.72 percentage points |
Source: S01 pp.22, 195. This compares full years, not a full year with a half-year.
The underlying identity is straightforward: expensed R&D equals total R&D minus new capitalized R&D. Apply it to both years and the difference in expense equals the difference in total investment minus the difference in capitalization. Expressed as a decline, CNY111.295 million equals CNY74.699 million plus CNY36.596 million.
This decomposition separates two questions. The CNY74.7 million reduction asks why the cost assigned to total R&D activity was lower. The CNY36.6 million increase asks why a larger amount qualified for asset recognition despite that lower total. They can have related business explanations, but they are not the same question. A generic reference to cost control would not, by itself, explain the project-stage judgment behind the second amount.
About 32.88% of the expense decline is the arithmetic component associated with increased capitalization. The remaining approximately 67.12% is associated with the reduction in total R&D investment. Calling the first percentage a share of the expense decline is accurate. Calling it a share of the improvement in shareholder profit would not be accurate, because shareholder profit is affected by many other accounts and by tax and ownership allocations.
There is also a useful distinction between the capitalization amount and the capitalization rate. The amount increased by about 20.09%. The share increased by 3.72 percentage points. A percentage-point change compares two percentages by subtraction; a relative percentage change divides the increase by the initial value. Those are different calculations. The rate shows a change in the mix of R&D recognition, while the amount shows the absolute cost following the asset route. [S01, p.22]
The R&D summary marks the section for explaining a substantial change in the capitalization rate as not applicable. That is a disclosure fact worth reading alongside the numbers. This review has not established the relevant trigger threshold or all accompanying disclosures, so it does not infer a disclosure-rule violation from the checkbox. The narrower question remains useful: what project developments explain the changed mix, and where can a reader find that explanation? [S01, p.22]
A second calculation, with a different purpose
A constant-mix calculation can help isolate the change in the capitalization share. Take the actual 2024 share, approximately 13.6695%, and apply it mechanically to actual 2025 total R&D investment of CNY1,257,918,335.33. This produces hypothetical capitalized R&D of CNY171,950,837.48. The actual 2025 amount was CNY218,757,846.57, approximately CNY46,807,009.09 higher. [S01, p.195; calculation]
That CNY46.8 million is not the same as the CNY36.6 million annual increase. The first calculation holds the capitalization share constant while allowing total R&D to change. The second compares the two actual capitalization amounts. Because total R&D fell, the constant-share hypothetical would have capitalized less than the actual 2024 amount. This explains why the two calculations give different, compatible answers.
| Question | Calculation | Result |
|---|---|---|
| How much did actual annual capitalization increase? | 2025 actual less 2024 actual | CNY36.596 million |
| How much higher was 2025 capitalization than a constant-2024-share illustration? | 2025 actual less 2025 total multiplied by 2024 share | CNY46.807 million |
| How much did actual R&D expense decrease? | 2024 expense less 2025 expense | CNY111.295 million |
Source: S01 p.195; deterministic calculations. The constant-share row is a hypothetical, not a proposed accounting correction.
The hypothetical is useful because it expresses the changed recognition mix in money. It is not a claim that maintaining last year’s percentage would have been correct. A portfolio containing more qualifying development work could legitimately have a higher share. Conversely, a mechanically stable percentage would not prove that the project judgments were sound. Accounting should follow the underlying activity and evidence, not preserve a ratio for appearance’s sake.
Under an otherwise-unchanged allocation illustration, the CNY46.8 million difference would sit in current R&D expense rather than new capitalized cost. That is a pre-tax cost-allocation sensitivity. It is not a restatement of net profit, a prediction of future impairment, or a figure to add directly to the reported loss attributable to shareholders. Old assets’ amortization, taxes, and minority ownership would still need to be considered.
A reader gains more from this calculation when it is paired with project evidence. The question is whether the changed mix can be traced to technical milestones and credible intended uses. A percentage can flag the question and size one sensitivity. It cannot answer why the recognition decision was made.
The company’s five conditions
Visionox’s accounting policy distinguishes research from development. Research concerns acquiring and understanding new scientific or technical knowledge. Development applies research results or other knowledge to plans or designs before commercial production or use. Under the disclosed policy, research-stage expenditure enters current profit or loss. Development-stage expenditure qualifies for asset recognition only when the stated conditions are met together. [S01, p.142]
The first condition is technical feasibility: the asset can be completed so that it is capable of use or sale. This is more specific than saying a technology is promising. For an outside reader, useful evidence might include a documented stage of testing, an engineering milestone, or an explanation of the remaining work. This review has not obtained Visionox’s internal project approval records and does not invent particular tests or completion dates.
The second condition is the intention to complete and use or sell the asset. Management’s intention is necessary under the policy, but intention alone is not all five conditions. A company can want to finish a project while lacking adequate resources or a demonstrated route to benefit. A useful public explanation would connect the intention with the planned product, process, or internal use.
The third condition concerns how the asset will produce economic benefit. The policy refers to evidence of a market for the product or the asset, or evidence of usefulness when the asset will be used internally. This makes the commercial connection essential. A technology can work technically without achieving enough demand, cost advantage, or useful internal performance to support its recorded cost.
The fourth condition is sufficient technical, financial, and other resources to complete development and use or sell the asset. The fifth is reliable measurement of expenditure attributable to the development phase. A reader needs to consider both completion capacity and cost tracking. General access to financing does not, by itself, identify which project’s costs were measured and from what date.
The policy adds two boundaries that are easy to overlook. If research and development phases cannot be distinguished, expenditure is expensed. Costs already expensed before the capitalization conditions were met are not subsequently restored to the asset. These provisions make the date of qualification important. The question is not just whether a project eventually became viable, but which costs were incurred after the qualifying point. [S01, p.142]
Following the balance through the project table
The 2025 development movement table lists categories described as QHD and other R&D projects and flexible-screen projects. QHD is retained here as the company’s project label; the table does not identify each underlying product or technical milestone. These broad categories allow a reader to reconcile totals without necessarily allowing a project-level assessment of future benefit. [S01, pp.195–196]
For the first category, the opening balance was CNY19.7 million, internal development additions were CNY80.8 million, and CNY68.1 million was transferred to intangible assets. The closing balance was CNY32.3 million. For flexible-screen projects, the corresponding figures were CNY79.6 million, CNY138.0 million, CNY89.1 million, and CNY128.4 million. The two rows reconcile to the total. [S01, pp.195–196]
| Development-expenditure movement | 2025 full year | First half of 2025 | First half of 2026 |
|---|---|---|---|
| Opening balance | CNY99.304m | CNY99.304m | CNY160.775m |
| Internal development additions | CNY218.758m | CNY94.778m | CNY124.463m |
| Transfer to intangible assets | CNY157.286m | CNY29.157m | CNY25.750m |
| Closing balance | CNY160.775m | CNY164.925m | CNY259.489m |
Sources: S01 pp.195–196; S02 p.127; S03 p.153. The first column covers twelve months; the next two each cover six months.
The closing development balance measures costs still in that classification at the reporting date. During 2025, additions exceeded transfers by CNY61.5 million, increasing the balance from CNY99.3 million to CNY160.8 million. During the first half of 2026, additions exceeded transfers by CNY98.7 million. That second interval produced a larger net increase even though it was shorter. The arithmetic describes the accumulation; it does not establish a project delay or failure.
The prior half-year provides a useful warning against extrapolation. Development expenditure reached CNY164.9 million at June 30, 2025, but ended the full year at CNY160.8 million. A midyear increase therefore did not mechanically continue at the same pace to December. Project additions and transfers can cluster in different parts of the year. The 2026 half-year increase should be examined, not simply doubled into a year-end forecast.
The tables state that there were no important capitalized R&D projects and no development-expenditure impairment allowance. Those statements sit below tables that plainly contain capitalized project balances. They cannot sensibly be read as saying there were no development assets. Nor does the absence of a recorded allowance guarantee that the assets will earn their expected benefits. It states the disclosed accounting position, not the result of future commercial activity. [S01, p.196; S02, p.127; S03, p.153]
Transfer is not disposal
The table’s reduction columns distinguish recognition as intangible assets from transfer into current profit or loss. The difference changes the meaning of the entire bridge. A transfer to intangible assets means the cost continues as an asset in another account. A transfer to profit or loss would place the relevant amount in an expense or loss route. Conflating the columns would turn an accounting progression into an unsupported claim of a write-off.
In the reviewed 2025 table, the CNY157.3 million reduction is located under recognition as intangible assets. The 2026 interim table similarly places CNY25.8 million under that heading. The current-profit-or-loss column is blank in those project movement rows. Those placements have been checked against the actual page images, not just a text extraction in which wide-table columns can lose their alignment. [S01, pp.195–196; S03, p.153]
An asset transferred out of development expenditure has not necessarily produced cash. It may have reached the intended-use stage and then be consumed over a useful life through amortization. Commercial sales, cost savings, and cash collections are separate events. Investors therefore need two follow-up questions: what supports the transfer date, and how is the transferred cost subsequently allocated to the periods benefiting from the asset?
Imagine, purely as an illustration, a completed development asset costing CNY100 million with a five-year useful life, no residual value, and a straight-line allocation. It would produce CNY20 million of annual amortization once the assumed full-year allocation applies. This is not Visionox’s disclosed project life or a forecast of its expense. It demonstrates why capitalized cost does not disappear: it can return to later periods as an expense even without a new cash payment.
Where that later cost appears also matters. Depending on the asset’s use and accounting treatment, an amortization charge can affect a different expense or production-cost category. A reader who tracks only the R&D expense line may not see the complete later burden of an earlier development decision. A project-level bridge into the intangible-asset note would make that path easier to follow.
The 2026 comparison changes the story
The first-half 2026 figures provide a meaningful counterweight to the annual observation. Total R&D was CNY675.0 million, compared with CNY587.8 million in the first half of 2025, an increase of approximately 14.84%. Expensed R&D rose from CNY493.0 million to CNY550.5 million, approximately 11.67%. New capitalization rose from CNY94.8 million to CNY124.5 million, approximately 31.32%. [S02, p.127; S03, p.153; calculations]
| R&D measure | First half of 2025 | First half of 2026 |
|---|---|---|
| Total R&D investment | CNY587.790m | CNY675.000m |
| Expensed R&D | CNY493.012m | CNY550.536m |
| New capitalized R&D | CNY94.778m | CNY124.463m |
| Calculated capitalized share | 16.12% | 18.44% |
Sources: S02 p.127; S03 p.153. Shares calculated from unrounded totals.
The capitalization share continued to be higher in the later comparison, but the amount expensed did not keep falling. That distinction prevents a convenient but inaccurate continuation of the headline. The annual case concerns how a lower 2025 total and more capitalization combined to reduce expense. The half-year case concerns a higher total distributed between both higher expense and higher capitalization.
The development balance increased much more sharply than either total R&D or capitalization alone because the bridge also depends on transfers. The first half of 2026 transferred CNY25.8 million into intangible assets, compared with CNY29.2 million in the corresponding prior half-year. A reader needs the balance, the additions, and the transfers together. Looking only at the capitalized share leaves the accumulation partly unexplained.
The 2026 table also includes CNY125.5 million of intangible-asset amortization within total R&D, compared with CNY68.3 million a year earlier. Again, the table does not identify all the assets behind that cost category. The increase reinforces the importance of following old assets as well as new development, but it cannot be treated as a direct measurement of amortization solely from the projects in the development movement table. [S03, p.153]
A changing consolidation boundary
In December 2025, Visionox brought Hefei Visionox Electronics Co., Ltd. into its consolidated financial statements. The annual report explains that an agreement with another shareholder required that shareholder to exercise voting rights consistently with Visionox’s position on specified matters. Visionox directly held 45.4545% of the equity and controlled 54.5455% of voting rights through the arrangement. [S01, p.196]
The economic stake and the controlled voting rights answer different questions. The stake indicates the direct ownership interest. The voting arrangement explains the disclosed control conclusion. Consolidation then changes which assets, liabilities, revenues, and costs enter the group accounts. It would be misleading to treat every increase between reporting dates as growth in exactly the same set of entities.
The 2026 interim report explicitly says Hefei Electronics’ revenue and costs entered the consolidated scope and contributed to increased revenue and costs within other products or services. That disclosure gives a concrete reason to be careful with year-on-year group comparisons. It does not quantify every component of R&D affected by the scope change. [S03, p.13]
For this article, the proper response is to identify the boundary and limit the inference. The disclosed group R&D figures are real group figures. They show the recognition mix reported for each period. They do not, without an entity-level bridge, prove how much of the change represents the same projects becoming more capitalizable versus a different mix of entities and activity entering the accounts.
An informative supplementary disclosure would show the R&D total, capitalization additions, and development balances both as reported and for a comparable continuing scope. That would not replace the consolidated accounts. It would help readers understand the economic source of a change already visible in them. Until such information is reviewed, the project-maturation explanation and the scope-change explanation remain partly difficult to separate.
What the broader financial numbers contribute
Visionox’s three-year comparative table shows substantial revenue growth between 2023 and 2024, followed by much slower growth in 2025. Revenue increased from CNY5,925.7 million in 2023 to CNY7,928.7 million in 2024 and CNY8,144.5 million in 2025. Losses attributable to shareholders were CNY3,726.1 million, CNY2,505.3 million, and CNY2,389.0 million respectively. [S01, p.11]
| Group background measure | 2023 | 2024 | 2025 |
|---|---|---|---|
| Revenue | CNY5,925.733m | CNY7,928.662m | CNY8,144.452m |
| Net profit attributable to shareholders | −CNY3,726.118m | −CNY2,505.335m | −CNY2,388.952m |
| Operating cash flow | CNY2,166.068m | CNY365.696m | CNY2,308.892m |
Source: S01 p.11. These are three years of background, not a five-year development-project history.
The 2025 attributable loss narrowed by approximately CNY116.4 million. It would be tempting to compare that improvement with the CNY36.6 million increase in new capitalization and describe a contribution to the profit improvement. The temptation should be resisted. The group has other cost movements, investment results, taxes, and non-controlling interests. The R&D decomposition alone does not reconstruct the attributable-profit bridge.
The first half of 2026 then reported revenue of CNY4,003.9 million, down 2.85%, and an attributable loss of CNY1,518.5 million, wider than the CNY1,062.0 million loss a year earlier. The OLED product category reported a gross margin of −7.94%, a deterioration of 6.84 percentage points. These figures give commercial context to questions about future benefit; they do not prove that each development project has lost its value. [S03, pp.8, 13]
A development project may be intended for a future product or internal improvement rather than the exact products currently generating losses. The meaningful test is whether its expected benefit remains supportable. Persistent losses make that explanation more important to understand, but the right evidence still needs to connect the particular asset to its intended use, expected demand, costs, and timing.
Scale also disciplines the argument. At year-end 2025, CNY160.8 million of development expenditure was approximately 0.34% of CNY47,110.7 million of total assets. The group had many larger assets and obligations. This is a focused note about one recognition pathway. Treating it as a complete diagnosis of the business would exaggerate both the amount and the reach of the reviewed evidence. [S01, pp.11, 195–196]
Positive cash flow does not settle the asset question
Visionox reported CNY2,308.9 million of operating cash flow in 2025 despite a consolidated net loss of CNY2,874.6 million. The consolidated loss differs from the loss attributable to shareholders because the latter excludes the portion assigned to non-controlling interests. When reading the indirect cash-flow reconciliation, the consolidated figure is the relevant starting point. [S01, p.191]
The reconciliation includes CNY1,942.1 million of fixed-asset depreciation and CNY300.4 million of intangible-asset amortization, among other adjustments. Those are noncash charges in the period. It also includes a positive CNY3,185.2 million adjustment for operating payables and a negative CNY1,562.6 million adjustment for operating receivables. These movements help explain why cash flow and accounting loss can diverge. They are not all attributable to R&D. [S01, p.191]
The company’s discussion says the operating-cash-flow improvement was mainly associated with lower operating cash outflows. The direct cash summary supports the direction: operating inflows fell 2.96%, while operating outflows fell 13.28%. A simple claim that cash improved because sales collected better would omit an important part of the company’s disclosed explanation. [S01, pp.22–23]
Nor does positive operating cash flow establish that a development asset will deliver future benefit. The group can collect receivables, adjust payment timing, and incur noncash charges while the prospects of a particular project remain a separate issue. Conversely, the presence of an accounting loss does not erase the value of actual cash generated. Both observations can be true without resolving the project-level question.
Capitalization itself does not put cash into the bank. It changes the recognition route for a cost. The cash effect and cash-flow classification depend on underlying payments and applicable treatment, information not fully supplied by the R&D summary. This review therefore does not attribute the operating-cash-flow increase to capitalization. A complete analysis would need to connect cost recognition, payment timing, and the cash-flow captions.
Company explanations and competing interpretations
The strongest benign explanation is project maturation. If more activity crossed the five-condition threshold in 2025, a higher capitalized share may faithfully describe a different portfolio stage. Evidence supporting this explanation would identify qualifying projects, the point at which the conditions were met, remaining technical work, and the route to use or sale. The aggregate table is consistent with that possibility but does not fully document it.
A second explanation is a reduction in research-stage activity or other R&D costs. The total fell even as capitalization rose. The cost composition shows, for example, that technical-service costs decreased from CNY131.0 million to CNY53.4 million. Other categories moved differently. This is a disclosed cost movement that may help explain lower total investment, but it does not identify why every development addition qualified for capitalization. [S01, p.195]
A third explanation is the long commercial cycle described by the company. Current losses can coexist with development intended to serve later products or production improvements. This interpretation becomes more persuasive when the expected benefits are specific and reasonably connected to the asset. A general statement that the industry is growing provides much less evidence than a description of the intended use, achievable cost improvement, or commercial milestone.
A fourth explanation is a changed reporting scope. The new consolidation boundary means group totals can change even without the same underlying projects changing their accounting treatment. That possibility should be investigated through entity-level comparisons, not ignored because it complicates the story. The interim report’s own scope explanation makes it relevant. [S01, p.196; S03, p.13]
September disclosures add company context rather than a project-level answer. The investor-relations record discusses work on foldable displays and the industry’s large capital requirements, depreciation burden, and long development cycle. These statements explain why management regards sustained technical work as commercially necessary. They do not identify when each cost pool satisfied the accounting conditions, or quantify the returns supporting the particular development balances. An industry opportunity and evidence for recognizing an individual asset are related but different propositions. [S04, pp.1-2]
The revised financing-use report published on September 29 proposes proceeds of no more than CNY3 billion, with the net proceeds used for working capital and debt repayment. It is a proposal, not evidence that CNY3 billion had already arrived. Nor does its stated use designate the entire amount as funding for the capitalized development projects examined here. The update is relevant to financing flexibility, but it should not be inserted into the R&D bridge as though it were a qualifying project addition or proof of future benefit. [S05, p.3]
The concern is that more costs may depend on judgments about future benefits that an outside reader cannot readily evaluate. It would be strengthened by evidence of delayed completion, weakened commercial assumptions, or poorly explained qualification dates. It would be weakened by clear project milestones, timely completion, supported useful lives, and subsequent benefits consistent with the recorded assets. The reviewed aggregate figures alone establish neither outcome.
What remains unresolved
The first unresolved question is the qualification date. Which projects accounted for the additional capitalized costs, and when did each satisfy all five conditions? Without that information, a reader can calculate the recognition mix but cannot test whether the costs were assigned from the appropriate point. The missing public detail is not a finding that the company lacks internal evidence.
The second question is the age and expected completion of the closing balance. Broad project categories can include items started at different times. A CNY259.5 million closing balance may represent ordinary work in progress, an expanded portfolio, or slower transfers. The amount alone does not distinguish them. A project-age or expected-completion breakdown would be more useful than merely repeating the aggregate total.
The third question is the path after transfer. What portion of intangible assets came from the development projects, what useful lives were assigned, and where does the related amortization appear? These details would allow readers to follow the future expense burden and compare it with the benefits. The R&D amortization category does not provide that complete identification.
The fourth question is recoverability under changed conditions. The policy explains how long-term assets are assessed for impairment indicators and how recoverable amounts are determined. This review has not obtained project-specific assumptions. The absence of a disclosed development-expenditure allowance should be read alongside those unknowns, not transformed into either a guarantee or an accusation. [S01, p.142]
Follow-up searches covered CNINFO announcement titles and investor-relations records dated March 1 through October 2, 2026, alongside the periodic reports and September documents cited below. This was a review of selected documents, not the full text of every indexed filing or every platform. The materials examined do not establish when individual projects qualified for capitalization, reconcile the changing reporting scope, or quantify project returns. Project-specific evidence could substantially narrow those questions.
Questions investors should ask
Which projects explain the increase from CNY182.2 million to CNY218.8 million in annual capitalization, and how do their qualifying milestones differ from the earlier year’s portfolio? A useful answer would connect amounts to project stages rather than provide only a general description of innovation.
How much of the CNY111.3 million decline in R&D expense reflects reduced activity, lower procurement costs, and a changed recognition mix? The disclosed identity separates two numerical components. More detail would explain the business reasons within them.
What does the designation of no important capitalized projects mean in this disclosure, and where can the underlying project-level information be found? The designation should not lead readers to overlook the actual development balances.
How will the CNY259.5 million development balance at June 2026 progress to intended use, and how will transferred amounts be amortized? Expected dates, useful lives, and cost categories would make future financial effects easier to track.
How much of the 2026 change comes from the newly consolidated entity, and what does a comparable continuing-scope analysis show? This would help separate growth in activity from a reporting-boundary change.
What evidence would require the company to revise its expected benefits or recognize impairment? The informative answer concerns the assets’ economics and monitoring, not only the fact that no development allowance was recorded at the latest date reviewed.
Conclusion
The overlooked detail is the split inside the R&D total. In 2025, Visionox invested less in R&D according to its disclosed cost table, but carried more of the year’s cost forward through capitalization. That combination made the R&D expense decline larger than the decline in total investment. The project bridge then shows that transfers continued into intangible assets while the remaining development balance grew.
The first half of 2026 adds an important qualification: both total and expensed R&D increased. It also adds a reason to keep following the asset, because the closing development balance increased again. Neither period supports declaring capitalization improper simply because the company reported losses. Both support asking for a clearer connection between qualifying costs, technical completion, commercial benefit, and later expense.
The amounts are already in the tables. What would make them easier to assess is a project-level account of when capitalization began, what changed in reporting scope, and how the completed technology is expected to earn back its cost.
Sources
Page references use the PDF page sequence. The research package retains the original Chinese titles and downloaded files; the English descriptions below identify the same documents.
| ID | Original document | Disclosure date | Main locations |
|---|---|---|---|
| S01 | 2025 Annual Report | 2026-04-29 | pp.11,14–15,22–23,142,191,195–196 |
| S02 | 2025 Interim Report | 2025-08-22 | p.127 |
| S03 | 2026 Interim Report | 2026-08-28 | pp.8,13,153 |
| S04 | September Investor Relations Activity Record | 2026-09-02 | pp.1-2: technology, capital intensity, and industry-cycle explanation |
| S05 | Revised Feasibility Report on the Use of Proposed Private-placement Proceeds | 2026-09-29 | p.3: proposed maximum and use of net proceeds |
Disclaimer
This report is based on the cited public information available by the stated cutoff and is prepared for educational and investor-protection purposes. It is not investment, legal, or accounting advice, or a recommendation to buy, sell, or hold any security. No misconduct is alleged unless a competent authority has made such a finding. Readers should conduct their own due diligence.