The Fine Print / Record 09
Cambricon's Inventory Has a Clock
Why the AI chipmaker's shrinking finished-goods balance and growing raw-material write-down deserve to be read together.
32 min read
Contents
Two lines beneath the growth
On page 109 of Cambricon's 2026 interim report, two entries point in different directions. The raw-material line records a CNY396.5 million net inventory impairment charge for the first half. The finished-goods line records a negative charge of CNY2.9 million. A few rows above, the finished-goods provision covers 67.63% of that category's gross carrying amount. That conspicuous percentage is attached to the category that contributed a small net release, not the category that produced the new expense. [S01, p.109]
The distinction matters at a company whose business has grown exceptionally quickly. First-half revenue reached CNY5.996 billion, more than double the previous first half, while profit attributable to shareholders reached CNY2.311 billion. Net inventory rose to CNY8.248 billion. Read in isolation, those figures can support opposite stories: inventory securing the next phase of growth, or inventory becoming harder to sell. Neither story can be established by the total alone. [S01, p.7; S01, p.109]
The smaller disclosure supplies a more precise question. What happens when materials acquired to protect future production remain in inventory long enough to incur a write-down before the associated sale arrives?
Cambricon has already described that mechanism. In its first-quarter impairment announcement, the company said that some raw materials acquired through earlier strategic stockpiling had aged, increasing the provision. It did not say that the whole stockpile had become obsolete or that demand for its current cloud products had failed. The announcement identifies a cost of waiting that can coexist with strong sales. [S08, p.2]
The first-half accounts bring that cost into view, but also show why it should be kept separate from the legacy finished-goods balance. Most of the inventory value now sits upstream, in raw materials and outsourced processing. The remaining finished goods carry a heavy provision, yet their gross balance has contracted sharply. For investors, the useful task is to follow these different populations through production, valuation and payment, rather than treating every item in the inventory note as a bet on the same product at the same time.
What matters in the numbers
Three findings establish the starting point. Raw materials and goods undergoing outsourced processing account for CNY7.697 billion, or 93.32%, of net inventory at June 30, 2026. Finished goods account for just CNY85.4 million after provisions, but their gross cost is CNY263.8 million. And almost all of the half-year's CNY397.0 million net inventory impairment expense comes from raw materials. These are different measures of the same business, not interchangeable descriptions of unsold chips. [S01, p.109; author calculations]
There is a second distinction on the cash-flow statement. Operating cash flow was only CNY311.3 million despite CNY2.311 billion of shareholder profit. However, trade receivables fell and customer cash receipts increased. The more substantial cash demands were procurement, prepayments and taxes, partly offset by expanding operating payables. The evidence points toward the financing and timing of expansion, rather than a simple story of profits trapped in unpaid customer invoices. [S01, pp.23,66,142]
The unresolved issue is the composition of the current upstream stock: its age, intended products, remaining completion costs and conversion into deliveries. The public tables identify the financial exposure but do not provide enough detail to reconstruct those relationships. Earlier inquiry responses contain unusually useful age and order information. They explain the mechanism, while stopping short of proving what every item held in June 2026 will become.
What an AI chip company holds before it sells
Cambricon designs artificial-intelligence chips and the software needed to use them. Its products include chips, accelerator boards and servers for cloud computing, products for edge computing, and intellectual-property licensing and software. Cloud products supply computing capacity for data centers and servers. Edge products perform computing closer to the equipment generating or using the data. Those applications have different customers and deployment requirements, so a broad increase in demand for AI computing need not benefit every historical product equally. [S01, pp.9-10]
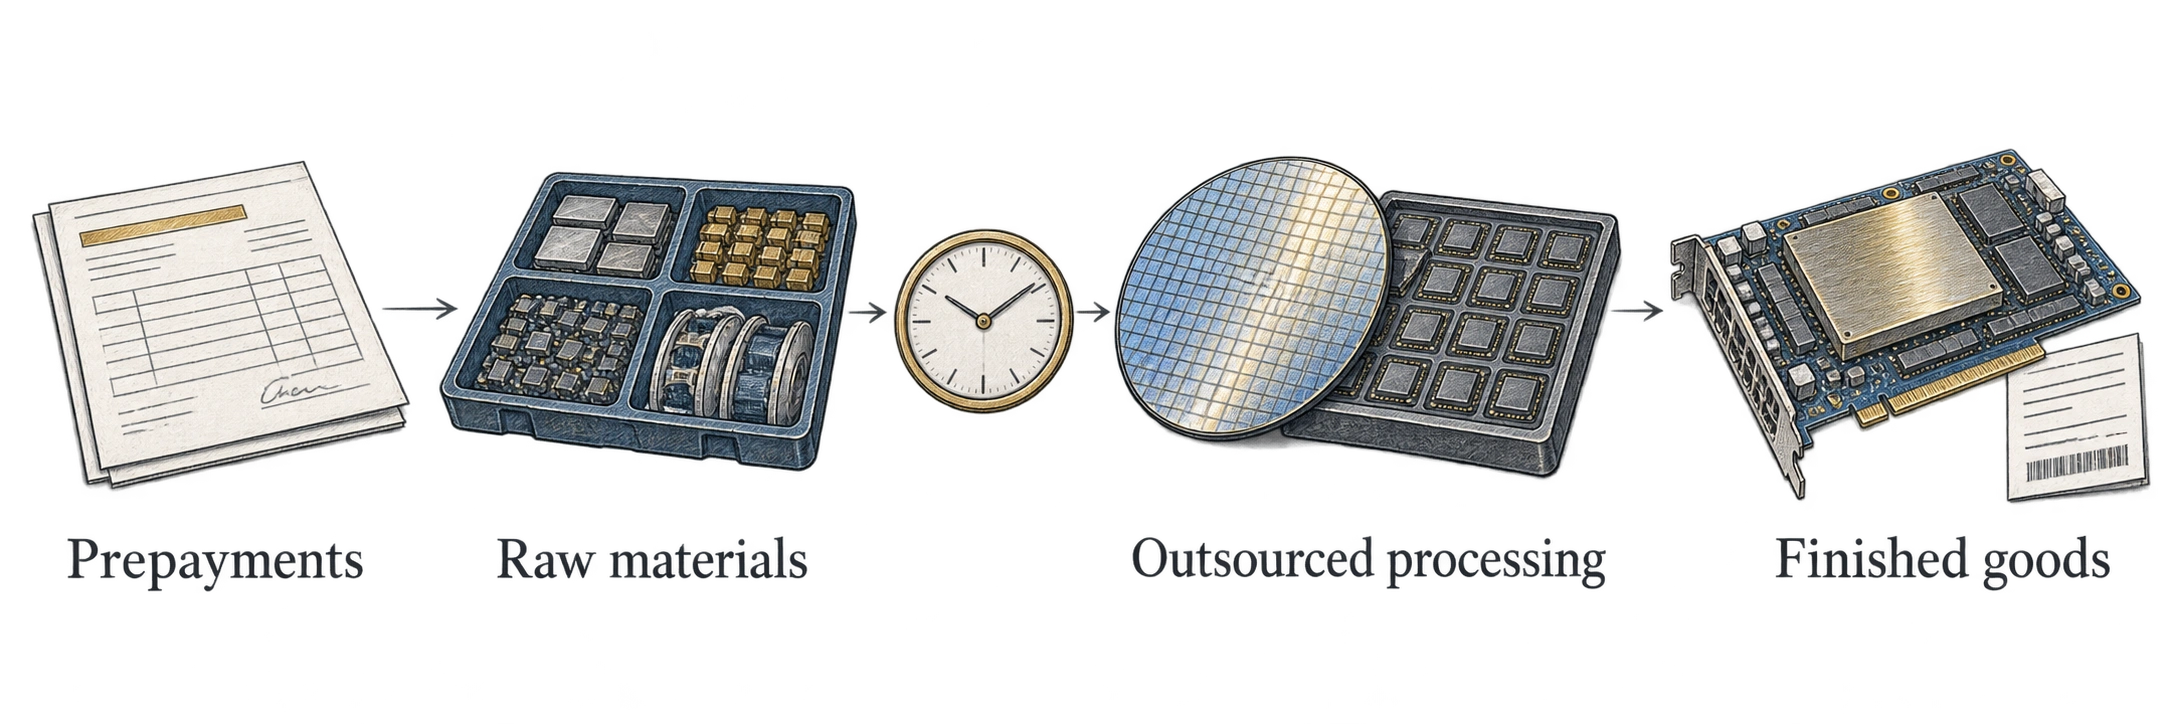
The company operates a fabless model. It relies on other businesses for manufacturing, packaging, testing and related production services rather than owning the entire fabrication chain. The financial commitment to a product therefore begins well before a finished board reaches a customer. Cambricon's 2025 inquiry response explains that advance payments can be used to purchase materials or secure production capacity, and that production has to be coordinated with upstream suppliers. [S02, p.25; S09, pp.104-106]
A prepayment is an asset representing payment ahead of delivery or performance. When the relevant materials or services arrive, the amount can move into inventory or another appropriate account. Inventory then accumulates the costs of getting the product to its current condition. Outsourced processing is an intermediate stage: the company has committed resources to goods being worked on by external manufacturers. Finished goods are further along, but even a completed product is not automatically a recognized sale.
Cambricon also reports dispatched goods as inventory. Its historical inquiry response defines these as goods already shipped for which revenue has not yet been recognized. That distinction prevents a common shortcut. A shipment can move a product out of the finished-goods category without completing the accounting sale, and recognizing revenue does not necessarily mean collecting cash at the same instant. [S09, p.110]
The steps help explain why a low finished-goods balance is not a direct measure of brisk demand. It could reflect prompt deliveries, changes in production scheduling, a changing product mix or the movement of goods into another category. Provisions can also reduce its net value. The balance sheet reports what remains at a date; it does not show every batch that passed through during the preceding six months.
Equally, a high raw-material balance need not consist of a warehouse full of completed products awaiting buyers. The category does not provide a product-by-product map of the components, their alternative uses or the further expenditure required to turn them into deliverable hardware.
This distinction becomes especially consequential during fast growth. Production commitments can rise ahead of sales, and purchases can be based partly on forecasts rather than confirmed orders. The company may be making a sensible supply decision while accepting a larger exposure to the timing and composition of future demand. An investor can recognize the first point without losing sight of the second.
Most of the value is still upstream
At the end of June 2026, Cambricon's inventory had a gross carrying amount of CNY9.015 billion. The provision against it was CNY767.6 million, leaving CNY8.248 billion on the balance sheet. The gross amount records cost before the valuation allowance; the net amount records the remaining carrying value after that allowance. Neither amount is the eventual selling price. [S01, p.109]
| Inventory category, June 30, 2026 | Gross cost, CNY million | Provision, CNY million | Net carrying value, CNY million |
|---|---|---|---|
| Raw materials | 5,749.2 | 470.9 | 5,278.4 |
| Outsourced processing | 2,536.8 | 118.4 | 2,418.4 |
| Finished goods | 263.8 | 178.4 | 85.4 |
| Dispatched goods | 465.3 | 0.0 | 465.3 |
| Total | 9,015.1 | 767.6 | 8,247.5 |
Source: S01 p.109. Figures rounded independently; calculations use the unrounded amounts.
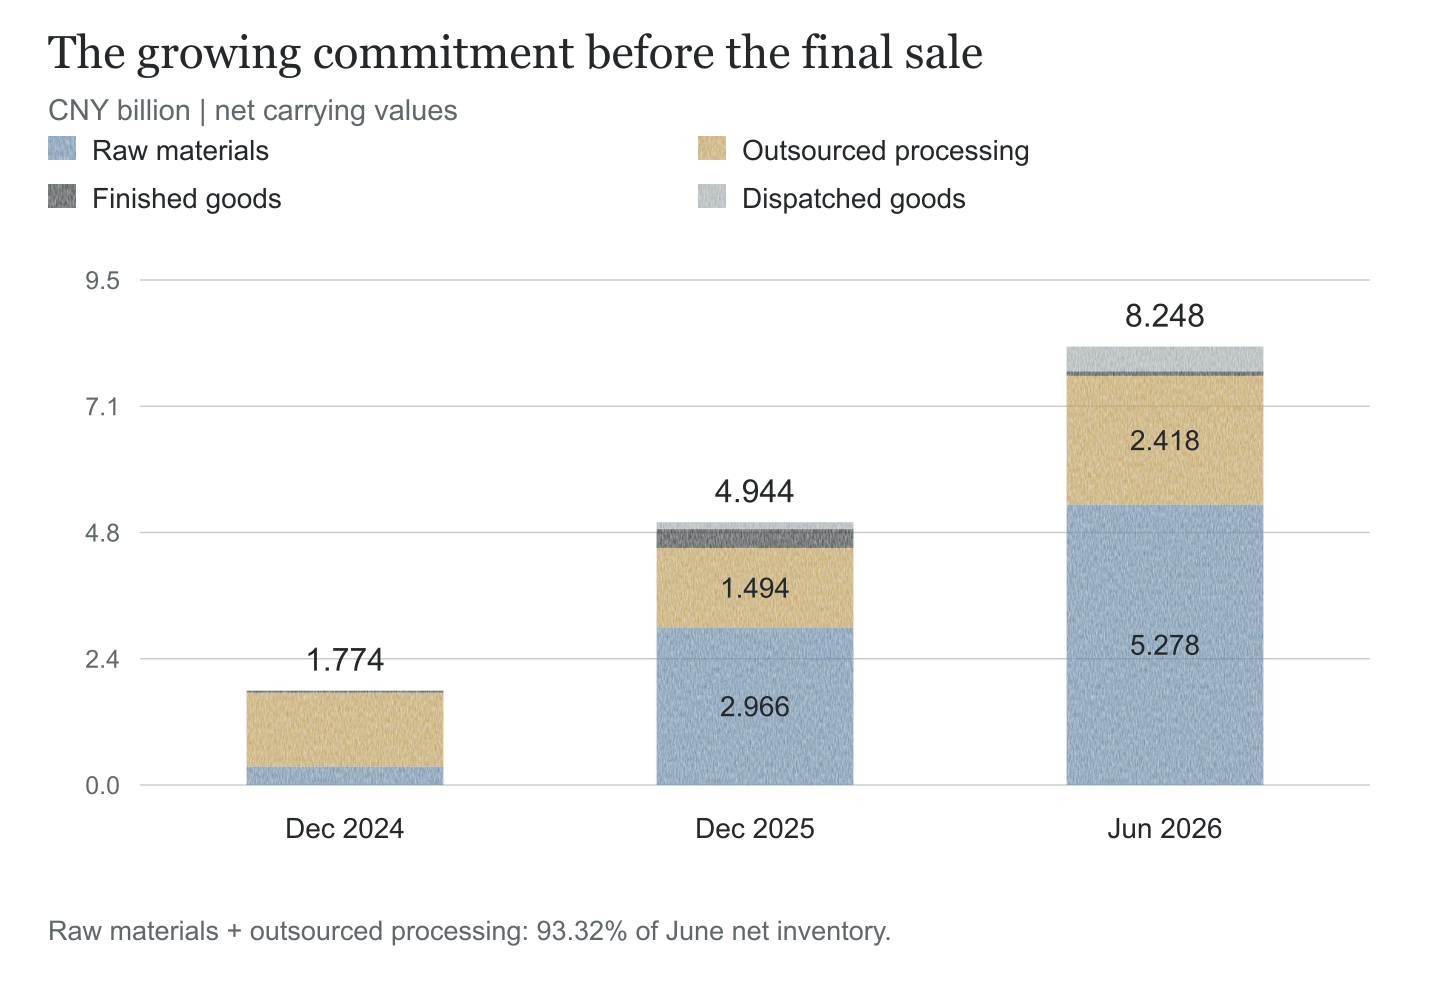
The two upstream categories dominate the remaining asset value. Raw materials alone have a net carrying value of CNY5.278 billion, and outsourced processing adds CNY2.418 billion. Together they represent 93.32% of net inventory. That is a share of carrying value, not a share of physical units, sales orders or inventory already written down. [S01, p.109; author calculations]
This structure has become much larger since the end of 2024. Net upstream inventory was CNY1.738 billion then, CNY4.460 billion at the end of 2025 and CNY7.697 billion in June 2026. The rising amounts show an expanding commitment to production before the final sale. They do not establish how much of that commitment is covered by firm customer orders at the latest date. [S03, p.165; S02, p.151; S01, p.109; author calculations]
The proportion alone can also mislead. Upstream inventory already represented about 97.96% of net inventory at the end of 2024, a higher share than in June 2026. Its lower share now does not mean less upstream exposure: the absolute amount is more than four times as large. A percentage describing composition must be read beside the amount it describes.
For a reader trying to understand the next stage of growth, the upstream balance asks several practical questions. Which products are the materials intended for? How much more production expenditure is needed? Can components serve alternative products if the original demand changes? How long can they be held before their expected value changes? The category totals do not answer those questions, but they identify where those answers would matter most.
A high percentage on a shrinking finished-goods balance
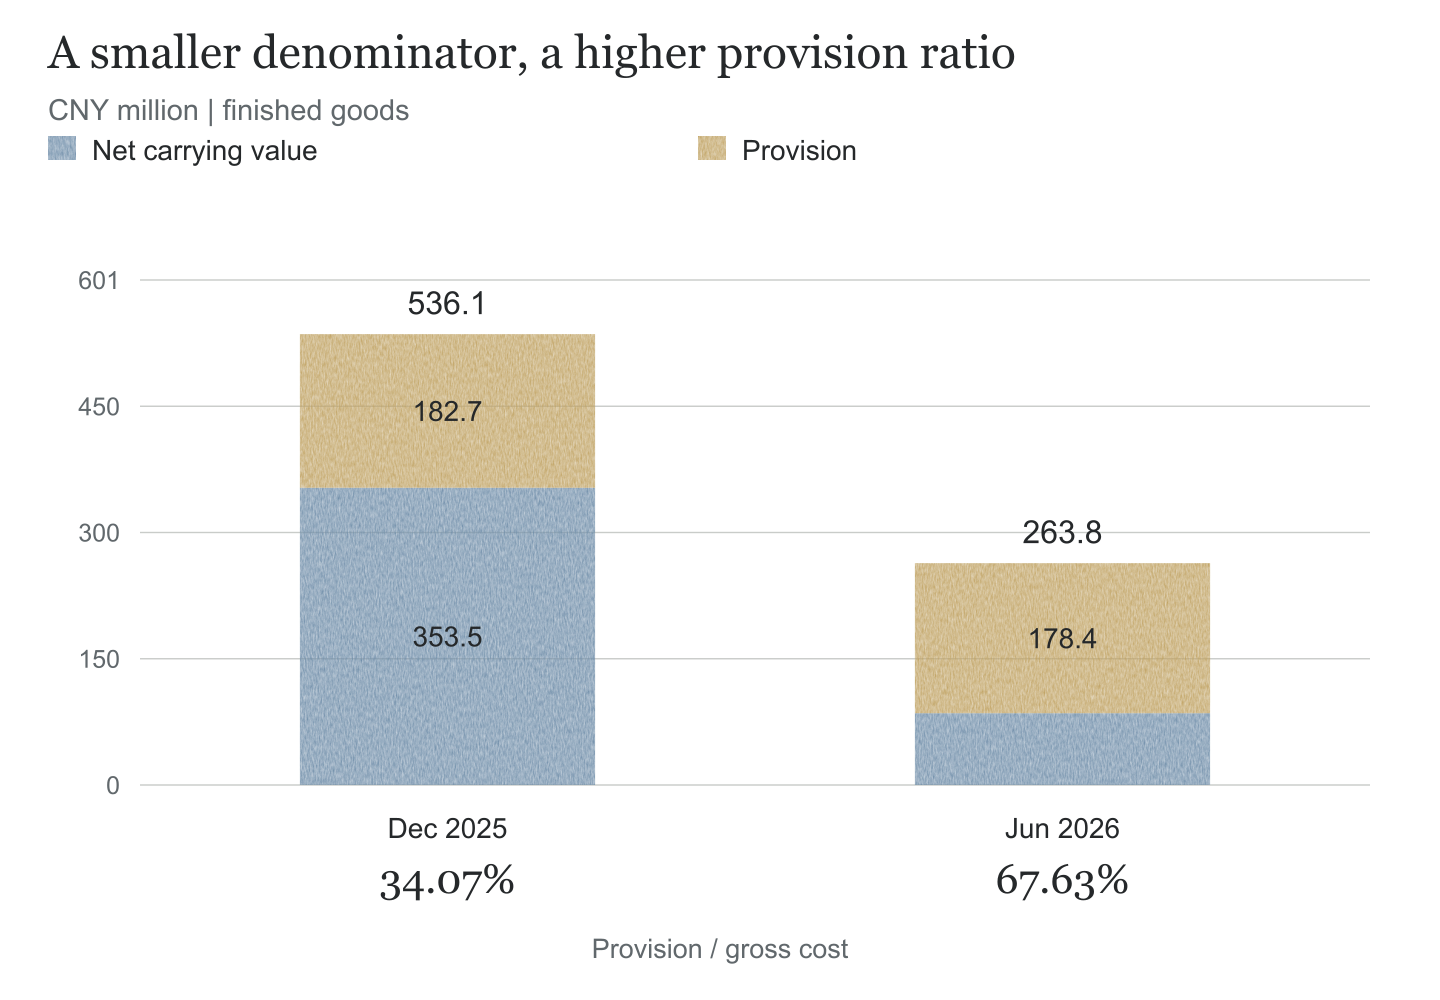
The finished-goods line appears to tell a much darker story at first glance. Its provision covers 67.63% of gross cost, compared with 34.07% at the end of 2025. But the numerator and denominator moved in ways that a percentage alone conceals. [S02, p.151; S01, p.109; author calculations]
Gross finished goods fell from CNY536.1 million to CNY263.8 million, a decline of roughly half. The associated provision fell slightly, from CNY182.7 million to CNY178.4 million. Dividing a nearly unchanged provision by a much smaller gross balance produces the higher percentage. It does not mean the company incurred a fresh loss equal to two-thirds of its finished goods during the first half.
| Finished goods | December 31, 2025 | June 30, 2026 |
|---|---|---|
| Gross cost, CNY million | 536.1 | 263.8 |
| Provision, CNY million | 182.7 | 178.4 |
| Net carrying value, CNY million | 353.5 | 85.4 |
| Provision divided by gross cost | 34.07% | 67.63% |
Sources: S02 p.151; S01 p.109; author calculations.
The remaining balance is still heavily provided for. That is a relevant fact about the stock held at the reporting date. Yet the table cannot identify the precise combination of deliveries, additions, consumption or other movements that brought it there. A plausible interpretation is that healthier goods moved through while a more heavily provided population remained. The published category totals do not establish that interpretation batch by batch.
The same limitation applies to an optimistic reading of the CNY85.4 million net balance. It cannot be treated as the cost of all physical finished goods. CNY178.4 million of their recorded gross cost has already been offset by provisions. A reader who overlooks that deduction can mistake a valuation adjustment for evidence that almost everything has been sold.
The provision movement offers a firmer conclusion. The finished-goods category has a negative CNY2.9 million entry in the period's charge column and a further CNY1.4 million reduction in the column for reversals or utilization. Its closing provision consequently declined by CNY4.3 million. The report explains utilization as previously provided goods being consumed or sold. That accounting movement should not automatically be described as an additional release into profit. [S01, pp.109-110]
The percentage therefore describes a concentrated residual exposure, while the movement schedule describes what affected the period. Treating the two as the same number would obscure the more consequential change elsewhere in the note: the substantial new raw-material charge.
The new charge comes from raw materials
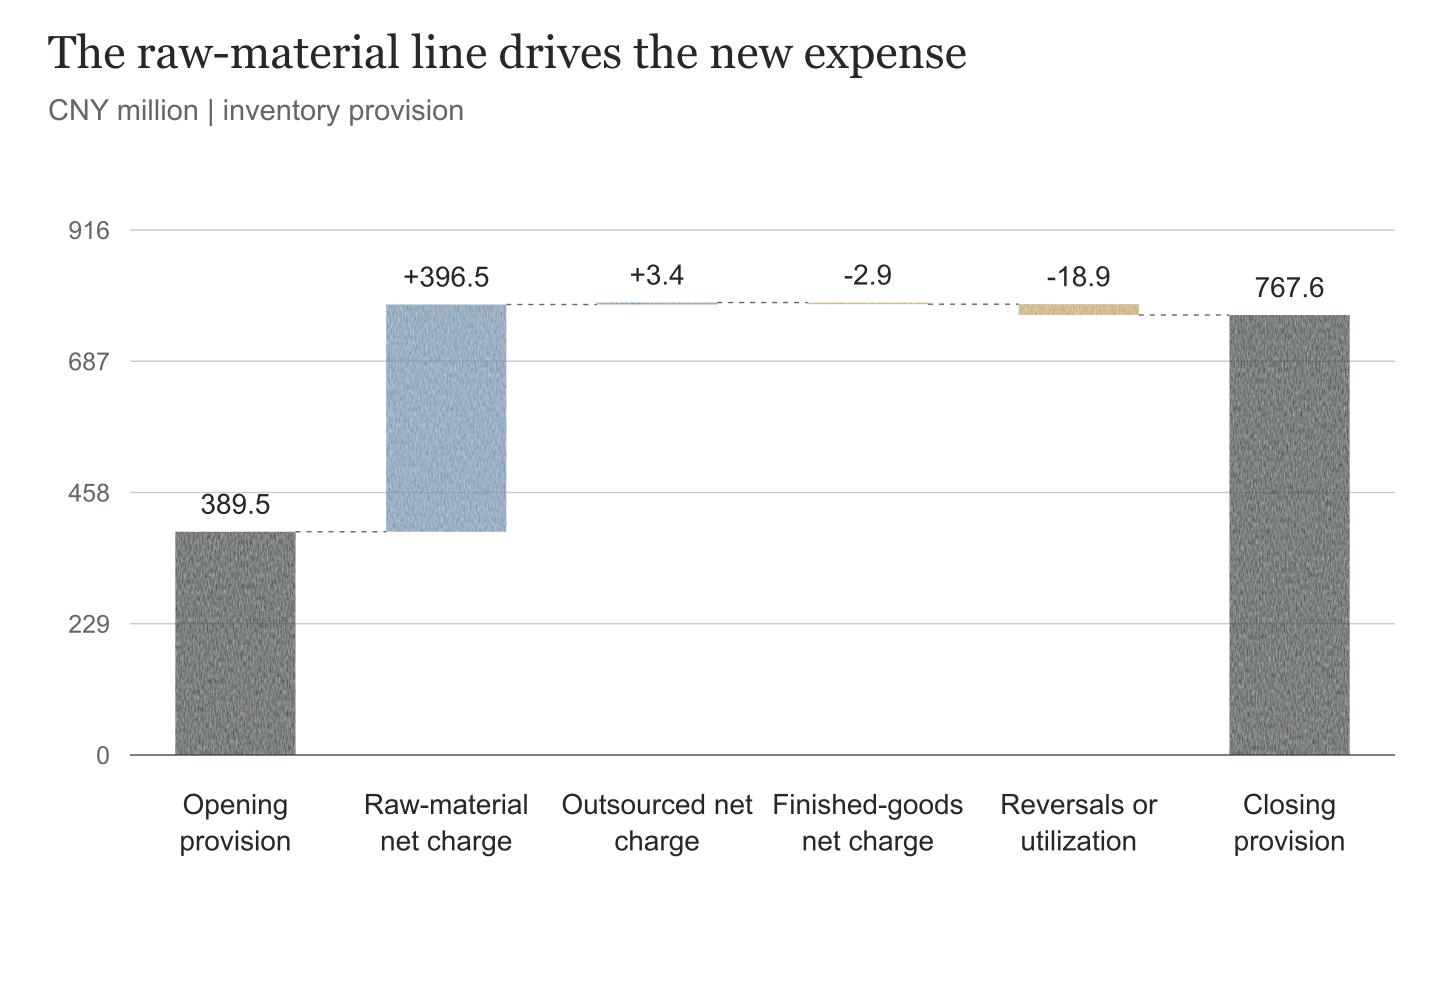
The raw-material provision rose from CNY78.3 million at the end of 2025 to CNY470.9 million in June 2026. The movement schedule records CNY396.5 million in net charges and CNY3.9 million in reductions through the reversal-or-utilization column. The arithmetic reconciles the opening balance to the closing balance. [S01, p.109]
Outsourced processing contributed a much smaller CNY3.4 million net charge, while finished goods contributed the negative CNY2.9 million entry. Across all categories, the half-year's net inventory charge was CNY397.0 million. After CNY18.9 million of reductions in the movement schedule, the total provision increased by CNY378.1 million, from CNY389.5 million to CNY767.6 million. [S01, pp.109,137]
There are consequently three useful numbers: the closing provision, its net increase and the period's net expense. The CNY767.6 million closing provision is not the half-year's new loss. Nor is the CNY378.1 million balance increase the expense recognized in the income statement. The expense is the CNY397.0 million net charge, which the report separately identifies as inventory impairment.
Raw-material provision coverage also increased, from 2.57% of gross raw-material cost to 8.19%. That happened while gross raw materials grew from CNY3.044 billion to CNY5.749 billion. The company was both building the stockpile and recognizing a larger valuation deduction against it. A rising gross balance and a rising provision can occur together because newly acquired materials and older materials coexist within the same category. [S01, p.109; author calculations]
The first-quarter announcement provides the clearest explanation available for part of that development. Cambricon said it assessed different product forms separately and took raw-material age into account. It attributed the quarter's inventory impairment principally to the aging of some materials from earlier strategic stockpiling. The first-quarter financial statement records CNY246.3 million of asset impairment. The announcement identifies that charge as inventory-related. [S07, p.9; S08, pp.1-2]
Subtracting the first quarter from the first half leaves a further CNY150.7 million of net inventory impairment in the second quarter. That is an arithmetic derivation from the two reports, not a separately disclosed explanation of the second-quarter charge. The first-quarter statement does not establish that every subsequent charge had precisely the same cause, or that all raw materials crossed a particular age threshold. [S01, p.137; S07, p.9; author calculation]
An earlier document shows why the reference to age deserves attention. In its 2025 inquiry response, Cambricon disclosed different age-based provision schedules for different materials. Electronic components carried no age-based provision in the first six months, then 25% above six months through twelve months, 50% above twelve months through eighteen months, and 100% beyond eighteen months. Packaging materials, structural components and other raw materials had a different schedule, reaching 50% above six months through twelve months and 100% beyond twelve months. Other inventory forms had their own treatment. [S09, p.111]
Those schedules are historical disclosures covering the periods in that response. They are not a license to apply one percentage to all of today's raw materials. The 2026 interim report states the general policy of measuring inventory at the lower of cost and net realizable value, but does not publish a current inventory-age table or a detailed reconciliation to those earlier schedules. Its template entries for age-based groups are marked not applicable. The first-quarter announcement nevertheless explicitly connects raw-material provisioning to age. [S01, p.83; S08, p.2]
The connection is sufficient to establish that waiting can have a recognized financial cost. It is insufficient to calculate the age of the current CNY5.749 billion gross raw-material balance or forecast its next write-down. For that, readers would need the current age distribution, material types, applicable methods and evidence supporting expected recovery.
What a write-down does to profit
Net realizable value is the amount a company expects to recover from selling inventory in the ordinary course of business, after the costs still needed to finish and sell it. Raw materials are evaluated in relation to the finished products they will help produce. Their value therefore depends on more than the purchase invoice: the eventual selling price and the remaining production expenditure also matter. Cambricon describes these calculations in its inventory policy and note. [S01, pp.83,110]
Recognizing a provision reduces the inventory asset and records an expense. It does not itself require a new cash payment on the recognition date. The cash may have left earlier, may still be payable to a supplier, or may be associated with a mixture of paid and unpaid inputs. This explains why an impairment expense can depress profit while being added back in the indirect cash-flow reconciliation.
Adding it back in that reconciliation does not make the economic cost disappear. The adjustment prevents a noncash expense from being treated as a second cash outflow. Whether the company ultimately recovers the original purchase cost is a separate commercial question.
The timing can also affect how later profit appears. Consider a deliberately simplified example, unrelated to any Cambricon transaction. Inventory bought for CNY100 is written down by CNY20 in one period, leaving a carrying amount of CNY80. If it is later sold for CNY100 with no additional costs, the sale produces CNY20 of profit against the reduced carrying amount. Across both periods, the earlier CNY20 expense and the later CNY20 profit cancel. No extra CNY20 of lifetime economic profit has been created.
If the reason for the original write-down disappears before sale, the applicable inventory standard permits a reversal within the amount of the earlier provision. That is different from utilizing a provision when previously written-down goods are sold or consumed. The distinction is particularly useful when reading a combined movement-table caption: a reduction in the allowance does not, by itself, identify a recovery credited to current profit. [S18, Articles 14-19]
Cambricon's first-half finished-goods net charge was negative CNY2.9 million, a small amount beside CNY2.311 billion of shareholder profit. The accounts do not support a claim that the company's large earnings increase was manufactured by releasing that provision. They support the more limited point that past write-downs, current charges and subsequent sales belong to different periods and must be read together. [S01, pp.7,109]
Gross margin is another partial view. Cambricon reports inventory impairment separately from cost of sales. Its first-half gross margin was approximately 55.25%, compared with 55.93% in the previous first half. The CNY397.0 million inventory impairment expense is further down the income statement. A healthy-looking gross margin therefore does not encompass every cost associated with holding inventory. The company did recognize that expense in arriving at its reported profit; it should not be discarded merely because it is noncash at the time of recognition. [S01, pp.62,137; author calculations]
The older inventory has a different history
Cambricon's historical filings show how strongly a total provision ratio can be affected by the mixture of old stock and new procurement. At the end of 2023, gross inventory was CNY344.6 million and provisions were CNY245.2 million, leaving just CNY99.4 million of net value. The provision covered 71.16% of gross inventory. A year later, gross inventory had expanded to CNY2.044 billion and the provision to CNY270.0 million. Coverage fell to 13.21%, even though the provision amount increased. [S04, p.184; S03, p.165; author calculations]
The fall in the percentage did not demonstrate that the older inventory had recovered its value. The 2024 balance contained a much larger population of raw materials and goods undergoing outsourced processing. Those categories expanded the denominator. The provision against finished goods, meanwhile, increased from CNY198.8 million to CNY219.2 million. The aggregate ratio blended materially different populations. [S03, p.165]
| Year-end | Gross inventory, CNY million | Provision, CNY million | Net inventory, CNY million |
|---|---|---|---|
| 2021 | 316.9 | 29.9 | 287.0 |
| 2022 | 499.2 | 212.0 | 287.1 |
| 2023 | 344.6 | 245.2 | 99.4 |
| 2024 | 2,044.0 | 270.0 | 1,774.0 |
| 2025 | 5,333.1 | 389.5 | 4,943.5 |
Sources: S06 p.180; S05 p.192; S04 p.184; S03 p.165; S02 p.151.
The 2025 inquiry response supplies a commercial explanation for some of the older goods. Cambricon said the long-aged finished goods at the end of 2024 and March 2025 mainly originated in edge products accumulated at the end of 2022. Changes in market demand had prevented those goods from being sold. It also described the time required to optimize, debug and adapt products for more complex customer applications. [S09, pp.109-110]
At March 31, 2025, finished goods older than a year had gross cost of approximately CNY212.7 million and provisions of CNY198.3 million, or 93.25%. The response distinguished those goods from a much larger normal-age population. In other words, the document did not describe every product as equally impaired or every unsold item as facing the same commercial circumstances. [S09, p.109]
That history helps interpret the residual finished-goods balance, but it cannot identify every item remaining in June 2026. The interim report does not reconcile its finished goods to the same historical product cohorts. It would be an overreach to label the entire current balance as unsold 2022 edge products, just as it would be an overreach to infer that current cloud products face the same demand problem.
The stronger lesson concerns the analytical method. New procurement can lower an aggregate provision ratio without resolving old stock. Conversely, sales or other reductions in the gross balance can raise a category's ratio without a larger provision. The numbers can look more reassuring or more alarming while the underlying stock is changing. Following the amount, age and purpose of the inventory is more informative than assigning a verdict to the percentage.
Short customer orders, long production commitments
A company's inventory can be justified by expected demand even when little of it is matched to orders outstanding at a reporting date. That does not eliminate forecast risk. It explains why order coverage and demand are related, but different, concepts.
In the 2025 inquiry response, Cambricon reported that orders on hand at March 31, 2025 corresponded to 10.63% of gross inventory cost. The numerator was the inventory amount associated with the ordered products, not the selling value of the orders. The company attributed the low coverage partly to annual framework agreements under which customers issued purchase orders from time to time. The order cycle was short relative to the production commitment. [S09, p.106]
Cambricon also described its cloud and edge products as generally standardized rather than customized. Customers could purchase in batches and expect delivery quickly, while the company needed to coordinate manufacturing and testing months earlier. It cited market opportunities, constrained upstream capacity and international trade uncertainty as reasons to prepare inventory before formal orders arrived. [S09, pp.105-107]
These explanations give advance procurement a recognizable commercial purpose. Waiting for a firm order can create a delivery problem when production cannot be accelerated to the customer's timetable. Holding materials can preserve the ability to serve demand when it arrives.
But an annual framework agreement is not the same evidence as a specific firm order for every item acquired. And industry-wide demand for computing is not a commitment to buy a particular company's product in the quantity, configuration and period assumed when materials were ordered. Advance procurement transfers some of that uncertainty to the supplier holding the stock.
The response includes subsequent conversion data that is more useful than a snapshot of orders alone. For inventory held at March 31, 2025, the company reported conversion through May 31, 2025 of 26.88% for normal-age stock and 3.27% for stock older than a year. Normal age meant up to and including twelve months. The total conversion rate was 24.89%. The same observation period revealed a pronounced difference between age groups. [S09, pp.107-108]
Those percentages should not be recast as cash collection or revenue growth. They describe inventory cost transferred out under the response's conversion measure. Nor should the March balance's two-month observation window be compared casually with the longer window available for inventory held at the previous year-end. Different starting dates produce different opportunities for conversion. The age-group comparison is more informative because it shares a starting date and cutoff.
The numbers are also historical. A 10.63% order-coverage figure from March 2025 does not tell investors that the same share applied to the far larger stockpile in June 2026. It would be equally unsound to describe the remainder as inventory with no demand. What the earlier response establishes is a practical disclosure model: show the inventory's age, the relevant order-cost coverage and what subsequently happened to each population.
Concentration makes this model especially valuable. Cambricon's five largest customers represented 88.66% of 2025 revenue. Its largest supplier represented 55.34% of annual procurement. These are full-year measures, not a disclosed first-half 2026 customer or supplier map. They nevertheless show why changes in a small number of counterparties' timing can matter to a large procurement program. The unnamed counterparties should not be assigned identities from speculation. [S02, pp.25,30]
Cash is moving into the procurement chain
The cash-flow statement provides an important check on the inventory analysis. Cambricon's 2026 first-half customer receipts were CNY7.452 billion, compared with CNY4.035 billion a year earlier. Net trade receivables fell from CNY670.6 million at the end of 2025 to CNY222.0 million in June. The company attributed the reduction to collecting large receivables outstanding at the previous year-end. Those facts weaken an explanation of the profit-to-cash gap based simply on customers failing to pay. [S01, pp.23,66]
Customer receipts are not a precise collection rate for the current period's reported revenue. They can include prior-period receivables, advance receipts and tax-related amounts, whereas revenue follows recognition rules and a different tax presentation. Dividing the receipts by revenue would mix those populations. The cash figures demonstrate collection activity; they do not prove that every current sale has been paid.
There are also older receivables in the notes. The June balance includes individually assessed receivables of CNY163.3 million, against which the company recorded CNY129.5 million of allowances. Improved aggregate collection should not erase that residual credit exposure. It does, however, help locate the more substantial current working-capital demand. [S01, pp.97-98]
Payments to purchase goods and services reached CNY5.997 billion in the first half, up from CNY2.665 billion. Taxes paid rose from CNY20.3 million to CNY581.0 million. Taxes paid cover a different set of amounts and timing from the income-tax expense in the profit statement; the CNY581.0 million should not be labeled an income-tax charge. Procurement and tax payments together explain much of why stronger customer inflows did not translate into similarly strong net operating cash flow. [S01, pp.62,66]
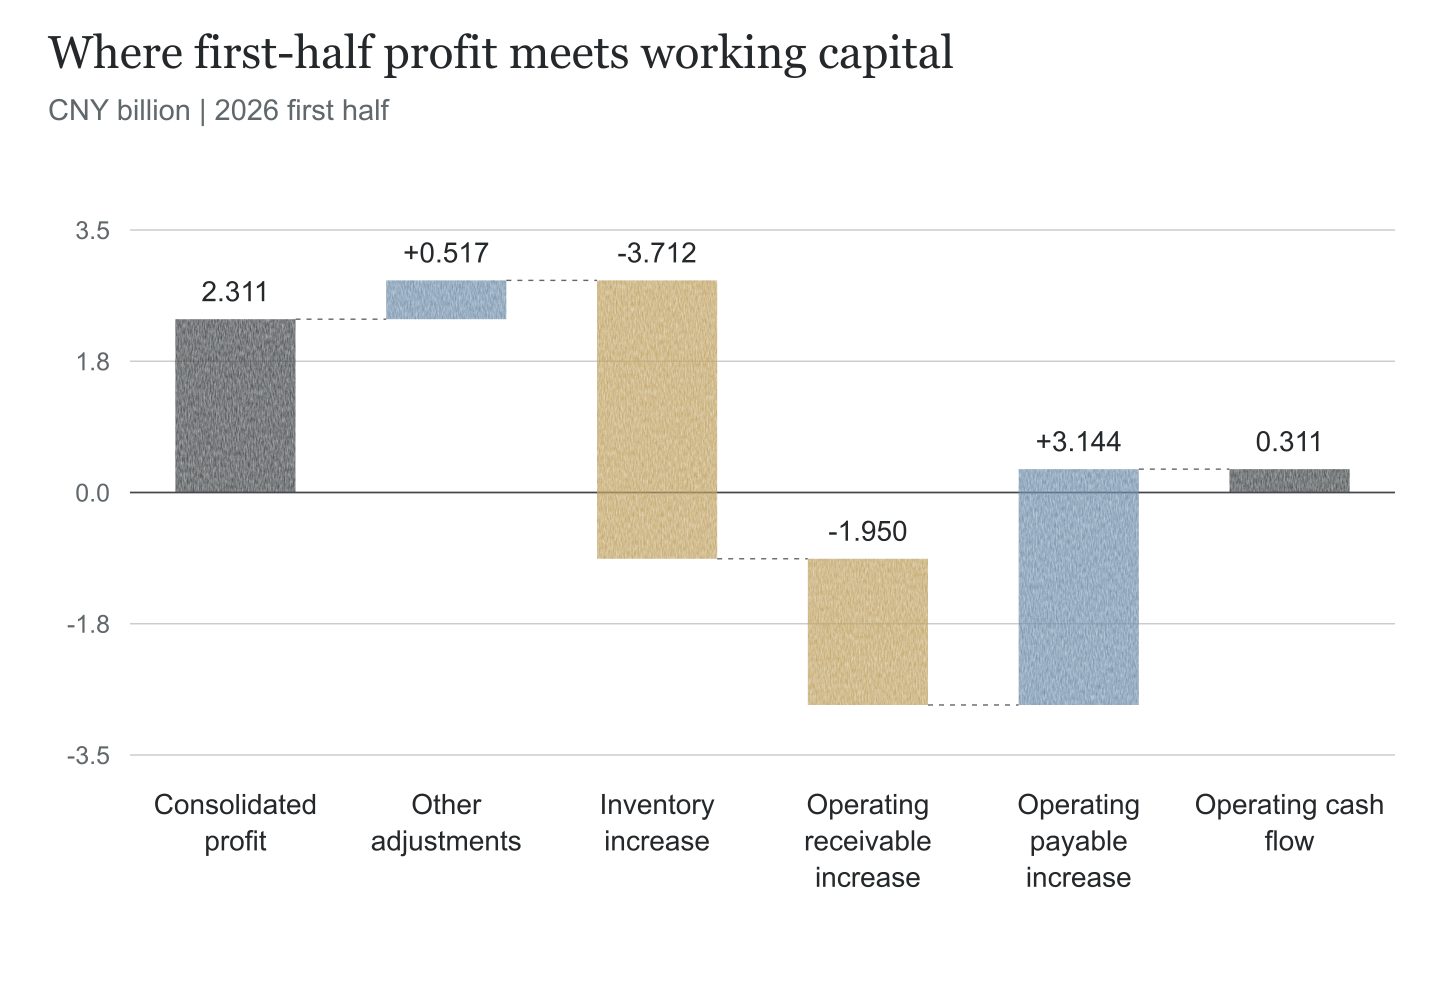
The indirect cash-flow reconciliation makes the working-capital effect explicit. It starts with consolidated net profit of CNY2.3108 billion, slightly different from the CNY2.3109 billion attributable to parent-company shareholders. After adjustments for impairment, depreciation, amortization, investment gains, share-based payments and other non-working-capital items, the subtotal is CNY2.8282 billion. Inventory and operating receivable movements then absorb substantial amounts, while operating payables offset part of the outflow. [S01, p.142; author calculations]
| Profit-to-cash reconciliation, 2026 first half | CNY million |
|---|---|
| Consolidated net profit | 2,310.8 |
| Other reconciliation adjustments, net | 517.4 |
| Inventory increase adjustment | -3,711.6 |
| Operating receivable increase adjustment | -1,949.6 |
| Operating payable increase adjustment | 3,144.4 |
| Net operating cash flow | 311.3 |
Source: S01 p.142; author aggregation of the other reconciliation adjustments. This table is an accounting bridge, not a measure of normalized earnings or free cash flow.
Operating receivables here are broader than trade receivables. Prepayments are part of the procurement exposure that has grown while trade receivables have fallen. Likewise, operating payables extend beyond the accounts-payable caption on the balance sheet. Reading the broad bridge categories as if they were only unpaid sales invoices and supplier invoices would miss the financing pattern.
The inventory adjustment is also different from the increase in net inventory on the balance sheet. The former is CNY3.712 billion; the latter is CNY3.304 billion. Provisions and other noncash inventory movements affect the reconciliation. The public accounts do not provide a complete batch-level bridge from inventory additions to cash payments, and that difference should not be filled with a guessed explanation.
The latest half-year total conceals considerable quarterly timing. First-quarter operating cash flow was positive CNY834.0 million. Subtracting it from the first-half total implies negative CNY522.7 million for the second quarter, when revenue was approximately CNY3.111 billion. That calculation shows why a single quarter's strong conversion should not be projected forward. It also does not establish a lasting deterioration from two observations. [S07, pp.1-2; S01, p.7; author calculations]
Prepayments and bills extend the timeline
Inventory is only part of the procurement chain. Cambricon's prepayments rose from CNY744.5 million at the end of 2025 to CNY2.914 billion in June 2026. Approximately 94.12% were less than a year old. The two largest prepayment counterparties together accounted for CNY2.598 billion, or 89.14% of the total. The note identifies them by rank rather than name. [S01, p.103; author calculation]
Prepayments and net inventory together were CNY11.161 billion, equivalent to 61.33% of total assets. That sum combines two distinct assets held at the same date. It is not a measure of cumulative cash expenditure or of irrevocable outstanding purchase commitments. When a prepaid delivery is received, the same amount may move from prepayments into inventory; counting both stages across time as separate purchases would overstate the commitment. [S01, p.57; author calculations]
The concentration is relevant to execution. A large prepayment balance depends on counterparties supplying what was ordered, and on the company integrating those deliveries into production. Age below one year is useful context, but it does not disclose the contractual delivery schedule or the cancellation and recovery terms. A payment may be recent and still represent a substantial exposure to timing.
On the liability side, bank acceptance bills payable rose from CNY350.9 million to CNY3.085 billion. Accounts payable increased from CNY765.0 million to CNY1.076 billion. Cambricon attributed the bill increase to greater use of bank acceptance bills for procurement payments, and reported no matured bills unpaid at the reporting date. These balances provide part of the explanation for how working-capital expansion was funded. [S01, pp.23,126]
Using a bill can separate the delivery of goods from the eventual cash settlement of the obligation. That can give production and sales time to catch up with the procurement program. It also leaves a future settlement requirement. A bill is not equivalent to permanent equity capital, and its existence does not demonstrate an overdue payment. Without the maturity schedule, readers cannot place all of the bills on a precise future cash calendar.
The company also held a substantial financial-asset buffer. June monetary funds were CNY1.126 billion and trading financial assets were CNY3.667 billion. These amounts should not be reduced to the CNY626.5 million cash-and-cash-equivalents figure used in the cash-flow statement, nor should all of them be presented as immediately available unrestricted cash. [S01, pp.57,142-143]
The cash note explains the CNY500 million difference between monetary funds and cash equivalents as money locked in advance for subscriptions to bank wealth-management products. This is not evidence of a judicial seizure. It also identifies CNY123.2 million of fundraising proceeds within cash equivalents whose use is restricted even though they are available for payment. The distinction concerns purpose and availability, not merely whether an amount appears in the cash total. [S01, pp.125,143]
Equity funding provides further context. A July 2026 announcement confirms that the company's 2025 share issue raised approximately CNY3.953 billion net of issue costs, allocated to specified projects and working capital. The existence of that funding weakens an immediate liquidity-crisis interpretation of low operating cash conversion, while the specified uses prevent treating all fundraising proceeds as a freely interchangeable procurement account. [S17, pp.1-2]
The relevant financing question is how supplier settlement dates, prepaid delivery dates, production completion and customer receipts fit together. The disclosed balances indicate the scale of that coordination. They do not establish a cash shortfall, but neither does an absence of ordinary short-term bank borrowings eliminate the need to manage trade obligations.
The earnings turnaround deserves its full context
The earnings turnaround is supported by more than a valuation release. Revenue was approximately CNY721 million in 2021, CNY729 million in 2022 and CNY709 million in 2023. It rose to CNY1.174 billion in 2024 and CNY6.497 billion in 2025. Profit attributable to shareholders moved from losses in those earlier years to CNY2.059 billion in 2025. First-half 2026 revenue was already CNY5.996 billion. These figures establish a markedly different operating scale from the periods when the older inventory accumulated. [S04, p.10; S02, p.9; S01, p.7]
Profit excluding the company's disclosed nonrecurring items reached CNY1.770 billion in 2025 and CNY2.166 billion in the first half of 2026. Those measures are not cash flow, but they help counter the claim that the turnaround consists only of subsidies or investment income. The first-half inventory charge remained an expense in the reported results. [S02, p.9; S01, pp.7,62]
Operating cash flow has followed a different path. It was negative CNY595.5 million in 2023, negative CNY1.618 billion in 2024 and negative CNY498.4 million in 2025. The first half of 2026 returned a positive CNY311.3 million, but that was below the previous first half's CNY911.2 million. These periods show that the earnings turnaround has not yet produced consistently strong operating cash generation. The annual totals and half-year comparisons also caution against judging collection or procurement timing from one reporting window. [S02, p.9; S01, p.7]
Cambricon also recorded CNY702.5 million of research and development expense in the first half, with no capitalized development expenditure reported in the corresponding table. Inventory accounting should not be confused with moving research costs into a development asset. The company's production stock and its spending on future designs occupy different accounts and present different questions. [S01, pp.18,58,62]
There is a small comparison trap in the research tables themselves. The 2025 annual report's research-investment table excludes share-based payment expense; the 2026 interim report explicitly says its research-investment measure follows the research expense in the financial statements. A reader comparing those tables across periods needs to check the scope before interpreting a growth rate. The inventory analysis does not require that comparison, but the footnotes reinforce the value of following definitions as well as totals. [S02, p.22; S01, p.18]
Strong growth gives management a defensible reason to buy ahead. It also makes the inventory estimate more consequential. When large balances depend on future demand, completion costs and eventual selling prices, successful current sales cannot establish the recoverability of every future input. The new charge is evidence that this distinction is already affecting reported earnings, even during the stronger operating period.
How the competing explanations can be tested
The strongest favorable interpretation is that Cambricon is acquiring inputs in advance to support expanding commercial demand and protect supply. Revenue, profit after excluding the company's disclosed nonrecurring items, cash receipts and the reduction in trade receivables all give this interpretation substance. The company's explanation of long production commitments and short purchase-order cycles is consistent with why a chip designer might hold more inventory than a simple order snapshot suggests.
Under that interpretation, the new raw-material charge could coexist with a commercially useful stockpile. Some inputs might age while others move promptly into production. Inventory acquired for resilience can have an accounting cost without representing a failed product strategy. The favorable case would become stronger if later disclosures showed timely conversion of the newer upstream balances, with satisfactory realized margins and manageable settlement requirements.
A less favorable interpretation is that the procurement commitment is outrunning the timing or composition of demand. Rapid sales growth at the aggregate level would not rule this out if materials were acquired for particular products or applications that converted more slowly. The historical edge-product experience demonstrates that such divergence has occurred before, but does not prove its recurrence in the current stockpile. The case would become stronger if aging upstream balances expanded, conversion remained weak over comparable observation windows, or further charges concentrated in the newly enlarged categories.
A third possibility is a temporary production or delivery delay rather than a persistent demand problem. Supplier timing, manufacturing stages and customer deployment can each postpone conversion. That explanation needs evidence of the bottleneck and subsequent completion. The location of stock in the raw-material or outsourced-processing categories alone cannot tell an outsider which constraint is binding.
These explanations can overlap. A company may secure essential supply, carry some excess materials and work through a production delay at the same time. A single good or bad label for the whole CNY8.248 billion net balance would conceal that mixture.
The most useful disclosure would therefore connect four pieces of information for the current inventory: age, intended product or broad application, valuation treatment and subsequent conversion. It need not name every confidential customer or expose individual commercial contracts. Aggregate categories can be informative if they preserve the distinctions that affect value.
The available accounts do not establish that Cambricon's provisions are inadequate, and the earlier schedules cannot calculate what the current provision ought to be. They establish where an investor's confidence rests on information not visible in the category totals. The useful distinction is between inventory supported by completed sales and inventory whose value still depends on future conversion.
What to look for in the next disclosure
An updated age table would be the clearest starting point. How much of the June raw-material stock remains within six months, six to twelve months, and the older bands? How do electronic components differ from other materials? Which valuation rules apply now? Without those distinctions, an increase in the provision cannot be separated cleanly into aging, changing price expectations, product mix and other causes.
A current order-cost and conversion table would add commercial context. The March 2025 response was useful because it defined the numerator and provided a subsequent observation cutoff. Repeating that approach for the much larger 2026 balance would allow investors to distinguish expected demand from actual conversion without mistaking a short order book for the absence of a market.
The remaining finished goods deserve a separate reconciliation. The rise to 67.63% provision coverage raises a question about the composition of what remains, not a conclusion about the current period's loss. A bridge showing additions, deliveries, disposals, consumption and associated provision movements would help explain whether the heavily provided residual is shrinking physically, changing in composition or merely becoming smaller relative to new production.
For the procurement chain, delivery schedules for significant prepayments and maturity information for bank acceptance bills would make the financing timeline easier to assess. Cash receipts, inventory conversion and liability settlement should be followed across several periods. A large cash receipt in one quarter and a large procurement payment in another may be part of the same growth process, but the relationship needs evidence rather than an assumption.
Investors reading the next report can keep the questions specific:
- What portion of the new raw-material provision comes from materials crossing age bands, and what portion reflects changes in expected recovery?
- Which broad product populations account for the upstream stock, and what happened to those populations after the reporting date?
- How much inventory cost is associated with firm orders, and how is that measure distinguished from framework agreements or forecasts?
- Does subsequent conversion produce sales and cash on the anticipated schedule, or only movement into another inventory category?
- How are the residual finished goods and their provisions being reduced, and what effect do those movements have on current earnings?
- When will the major procurement obligations settle, and which financial assets are available for those specific uses?
The answers could support the company's stockpiling strategy, reveal a more persistent mismatch, or show that a temporary constraint has eased. The important feature is that each answer relates to a defined population and period. A larger revenue total or a lower aggregate provision ratio cannot answer all six questions on its own.
The detail worth keeping in view
Cambricon's growth and the cost of carrying inventory are both visible in the accounts. The first-half sales and collection figures support a substantial expansion in business. The raw-material provision shows that part of the earlier procurement commitment has already incurred a recognized cost while waiting for conversion.
The most striking percentage in the inventory note belongs to the shrinking finished-goods balance. The most substantial new expense belongs to raw materials. Keeping those two facts separate changes the reading of the entire stockpile.
For the next stage, the decisive evidence will be what happens to the materials still upstream: how they age, what they become, what customers pay for the resulting products, and when the procurement obligations are settled. The opportunity created by securing supply and the exposure created by holding it are attached to the same assets. Time determines how much of each is realized.
Sources
Page references throughout refer to physical PDF pages, counted from the cover. For S09, PDF pages 101-114 correspond to printed pages 7-1-100 through 7-1-113. All financial amounts are CNY and use consolidated statements unless explicitly identified otherwise. Historical profit comparisons use the later reported adjusted figures. Display values are rounded; calculations retain the original amounts. The latest financial period used is June 30, 2026; the information cutoff is October 4, 2026.
| ID | Original document / English description | Public disclosure date | Principal locations | Original source |
|---|---|---|---|---|
| S01 | 2026年半年度报告 / 2026 Interim Report | August 8, 2026 | pp.7-10,18,23,57-58,62,66,83,97-98,103,109-110,125-127,137,142-143 | Company filing |
| S02 | 2025年年度报告 / 2025 Annual Report | March 13, 2026 | pp.9,22,25,30,97-102,151 | Company filing |
| S03 | 2024年年度报告 / 2024 Annual Report | April 19, 2025 | pp.10,106,165 | Company filing |
| S04 | 2023年年度报告 / 2023 Annual Report | April 30, 2024 | pp.10,121,184 | Company filing |
| S05 | 2022年年度报告 / 2022 Annual Report | April 29, 2023 | pp.135,192 | Company filing |
| S06 | 2021年年度报告(修订版) / Revised 2021 Annual Report | May 26, 2022 | p.180 | Company filing |
| S07 | 2026年第一季度报告 / 2026 First-Quarter Report | April 30, 2026 | pp.1-2,9 | Company filing |
| S08 | 关于2026年第一季度计提资产减值准备的公告 / First-Quarter 2026 Impairment Announcement | April 30, 2026 | pp.1-2 | Company announcement |
| S09 | 关于中科寒武纪科技股份有限公司2025年度向特定对象发行股票申请文件的审核问询函的回复 / Response to the Review Inquiry for the 2025 Private Placement | July 25, 2025, SSE disclosure version | Question 5; PDF pp.101-114, especially pp.104-111 | Issuer and sponsor response |
| S17 | 关于调整募投项目内部投资结构的公告 / Adjustment to the Internal Investment Allocation of Fundraising Projects | July 25, 2026 | pp.1-2 | Company announcement |
| S18 | 企业会计准则第1号——存货 / Accounting Standard for Business Enterprises No.1: Inventories | February 27, 2006, ministry webpage date | Articles 14-19 | Ministry of Finance |
The 2026 first-quarter and interim financial statements are unaudited. The company explanations above are attributed to the relevant filings; the calculations and interpretations are Red Market Filings' own. The analysis concerns information in the cited documents and does not claim that no further explanation exists outside them.
Disclaimer
This article is based solely on public information available through October 4, 2026. It is prepared for educational and investor-protection purposes only and does not constitute investment advice, legal advice, accounting advice, or a recommendation to buy, sell, hold or short any security. It does not allege misconduct by any company or individual. Reported facts, company explanations, author calculations and analytical interpretations are distinguished throughout. Readers should consult the original documents and conduct their own due diligence. Subsequent disclosures may change the analysis.
Continue reading
View all records
The Fine Print · Visionox · 002387.SZ
Visionox's R&D Expense Fell. Its Development Asset Grew.
Separating lower 2025 R&D investment from a larger amount carried forward as an asset.
The Fine Print · East Group · 300376.SZ
East's Debt Growth Has a CNY504 Million Non-Cash Line
Following a liability increase from its non-cash recognition to subsequent cash settlement.